Figure provenance
Recording figures
The heart-rate, interval and pupil plots use data/case-study/raw/hr_01.txt, ibi_01.txt and sed_01.txt directly. They describe the available samples from session 1.
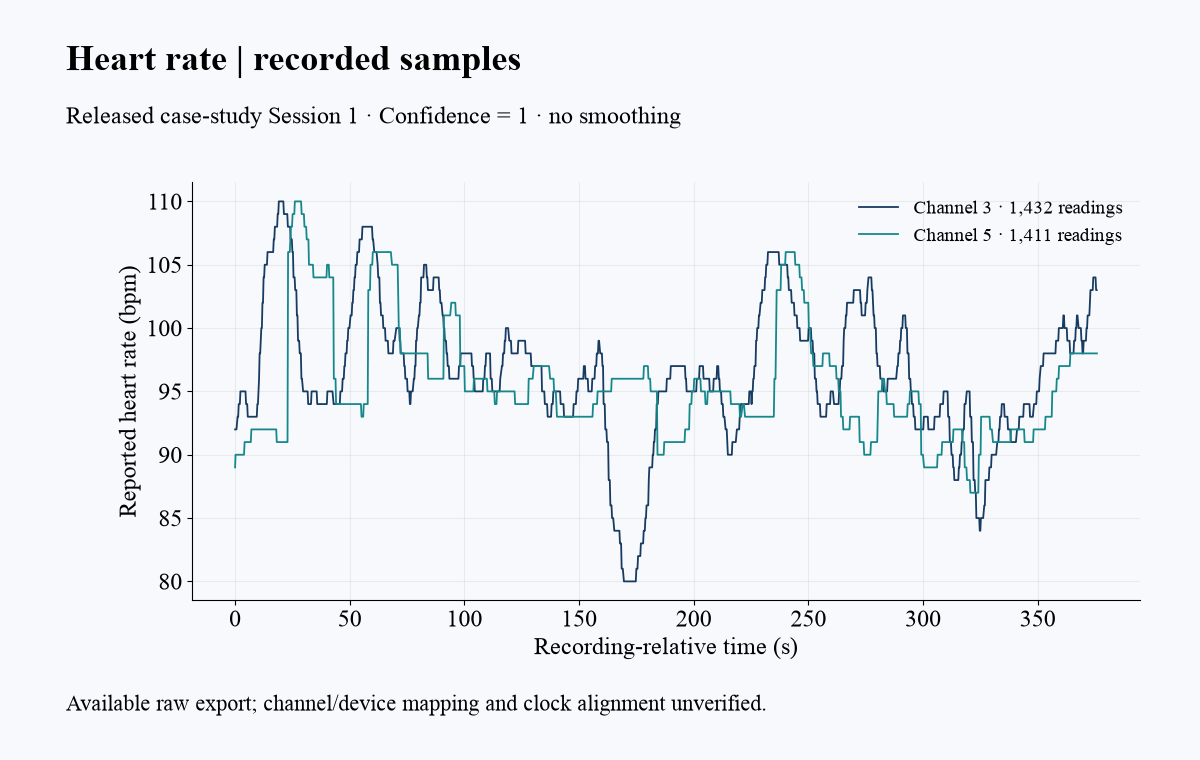
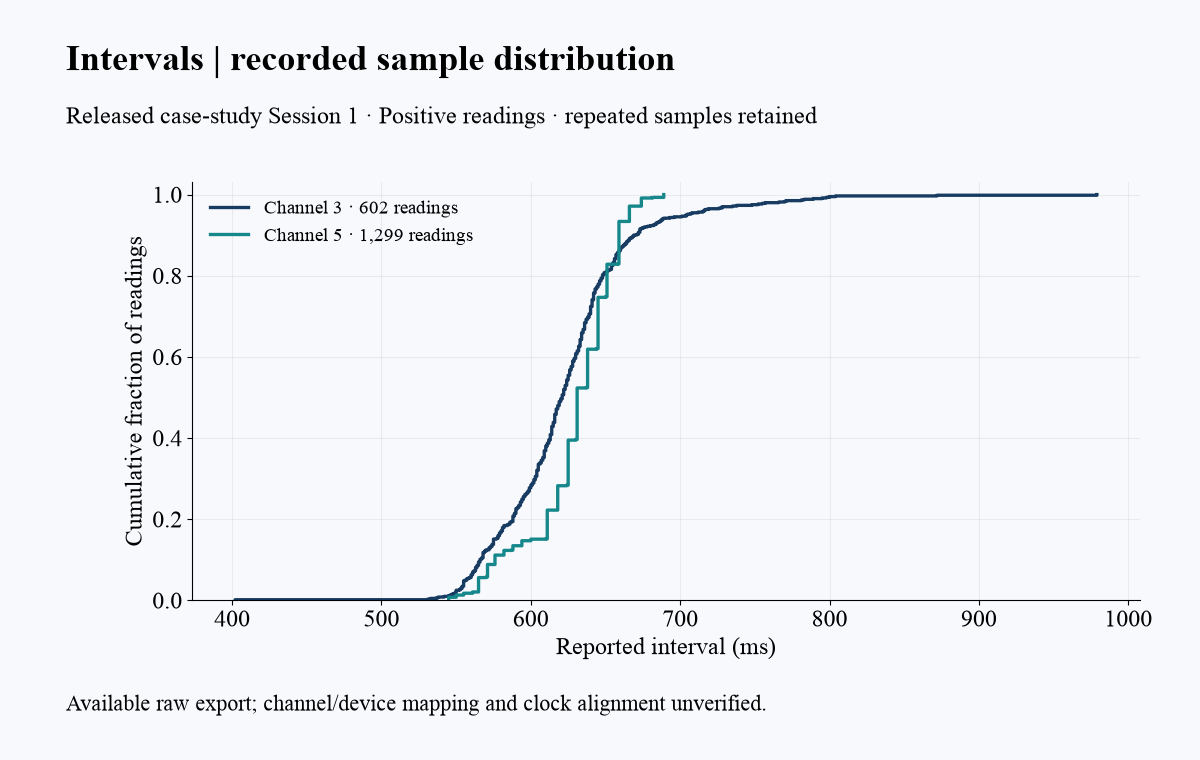
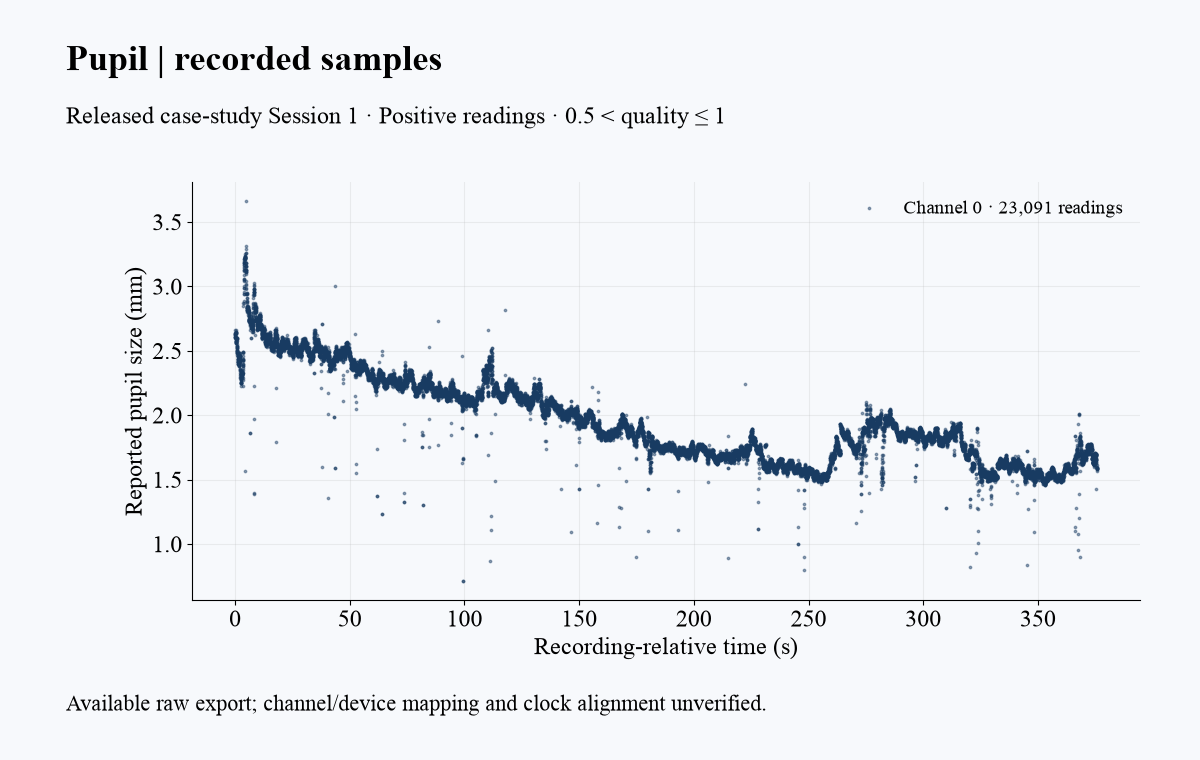
Heart rate retains finite positive readings with confidence 1. Intervals retain finite positive readings, including repeated samples. Pupils retain finite positive readings with 0.5 < pupilQ <= 1. Channels stay separate. Each stream uses its own recording-relative time in seconds; clocks are not aligned across streams. Reported units are bpm, ms and mm. Calibration and unique-beat provenance are unverified.
python -m scripts.build_recording_figures --check
python -m scripts.build_recording_figures --output-root outputs
outputs/recording-figures.toml records source hashes, a hash of the exact selected values, filters, units, counts and image hashes. Check mode writes nothing. These plots do not establish anxiety categories or validate the ten-person group tables.
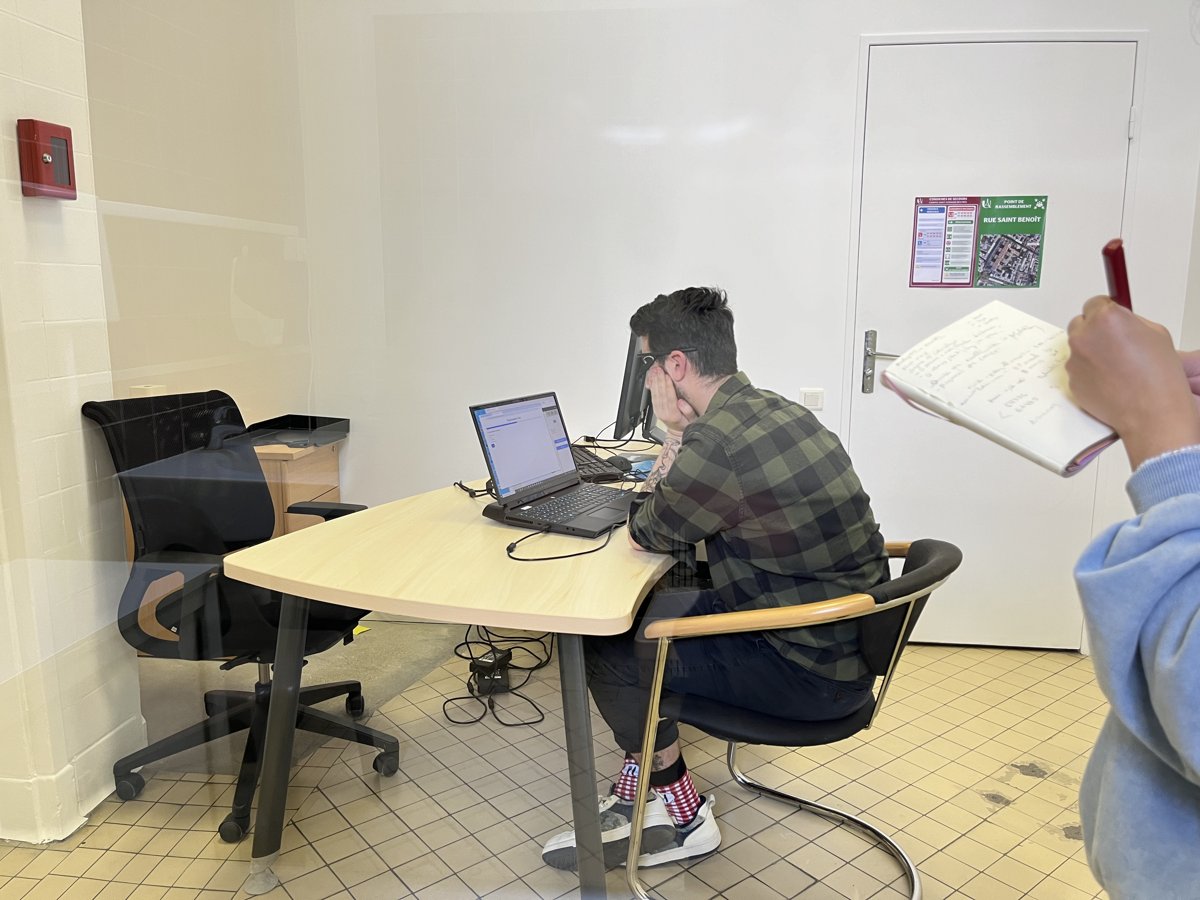
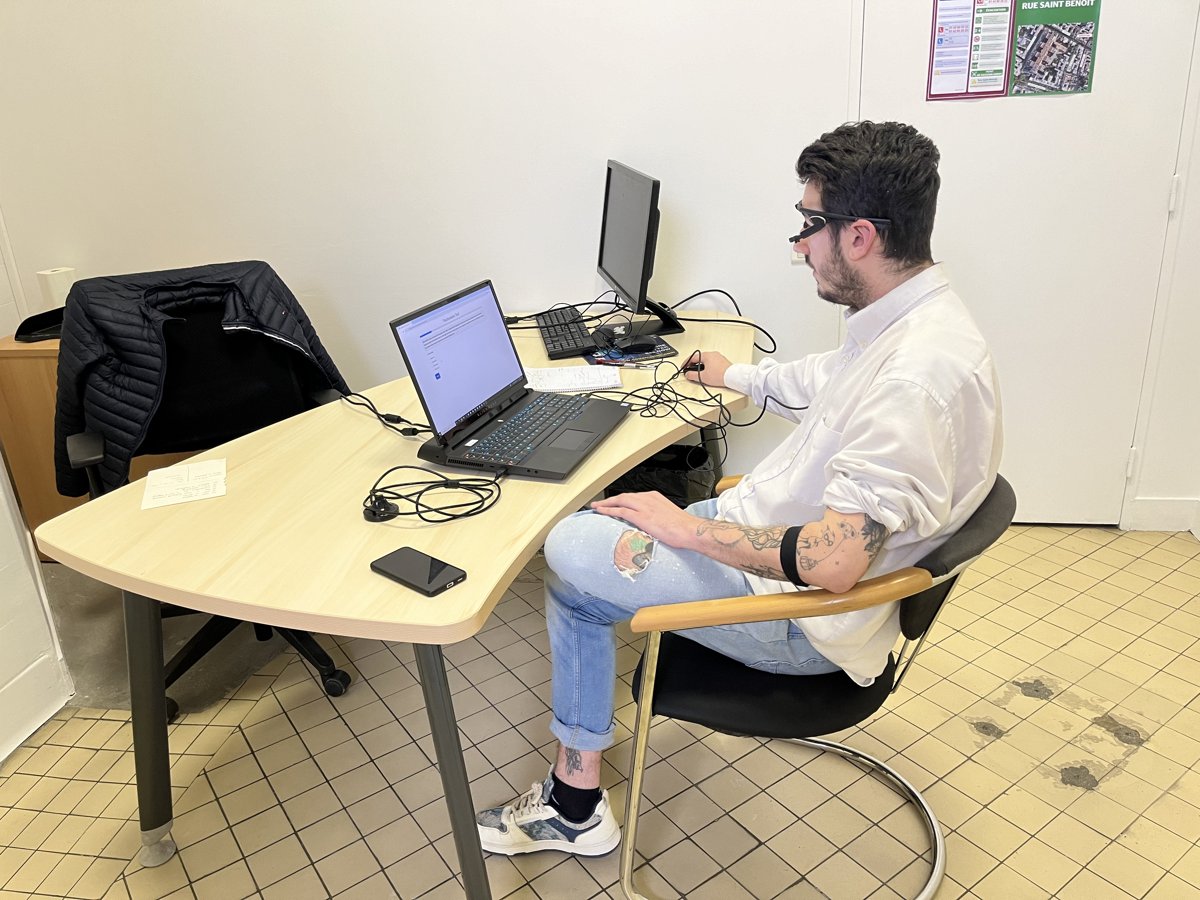
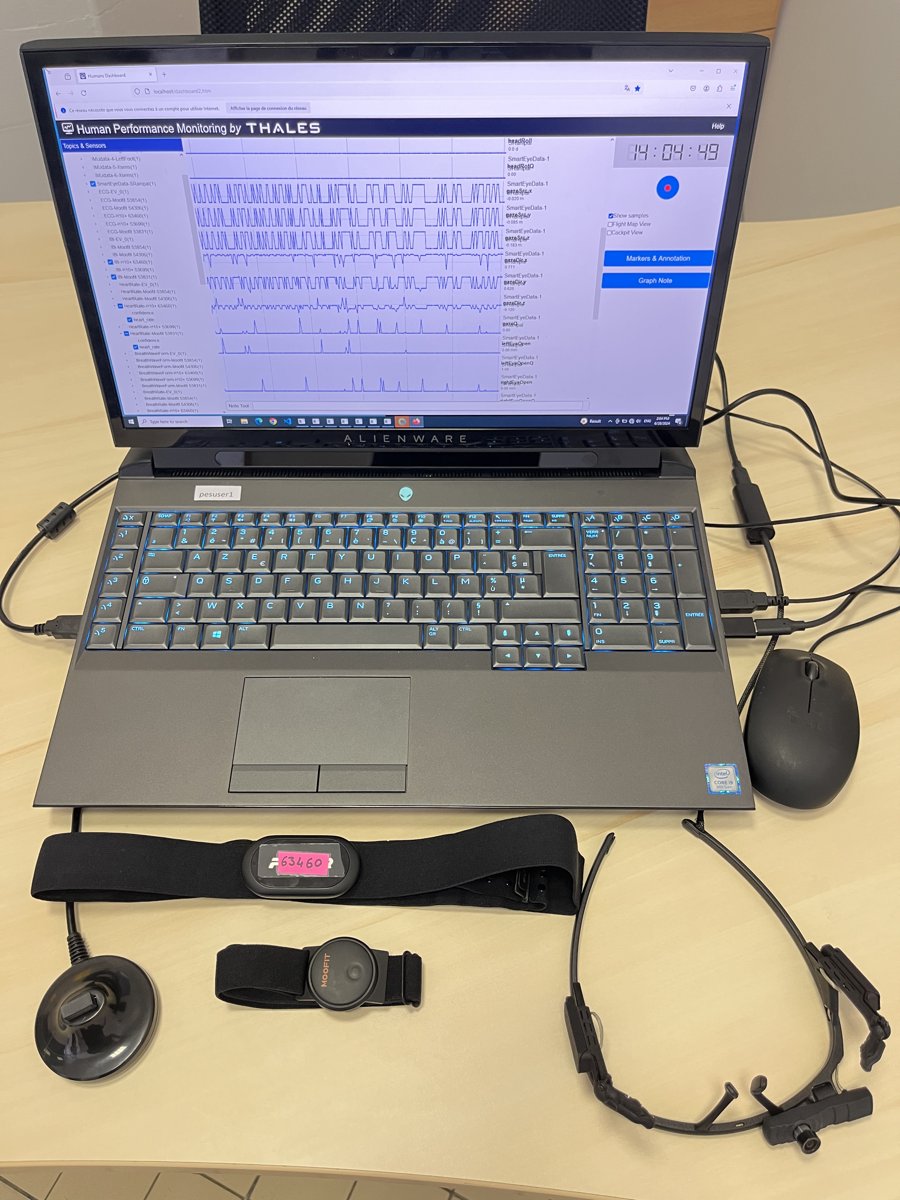
The session photograph appears in thesis Annex E, PDF page 46, printed page 49. Its caption explicitly records photo consent. The experimental setup photograph is also preserved. Source image bytes are unchanged.
Historical group-summary calculations
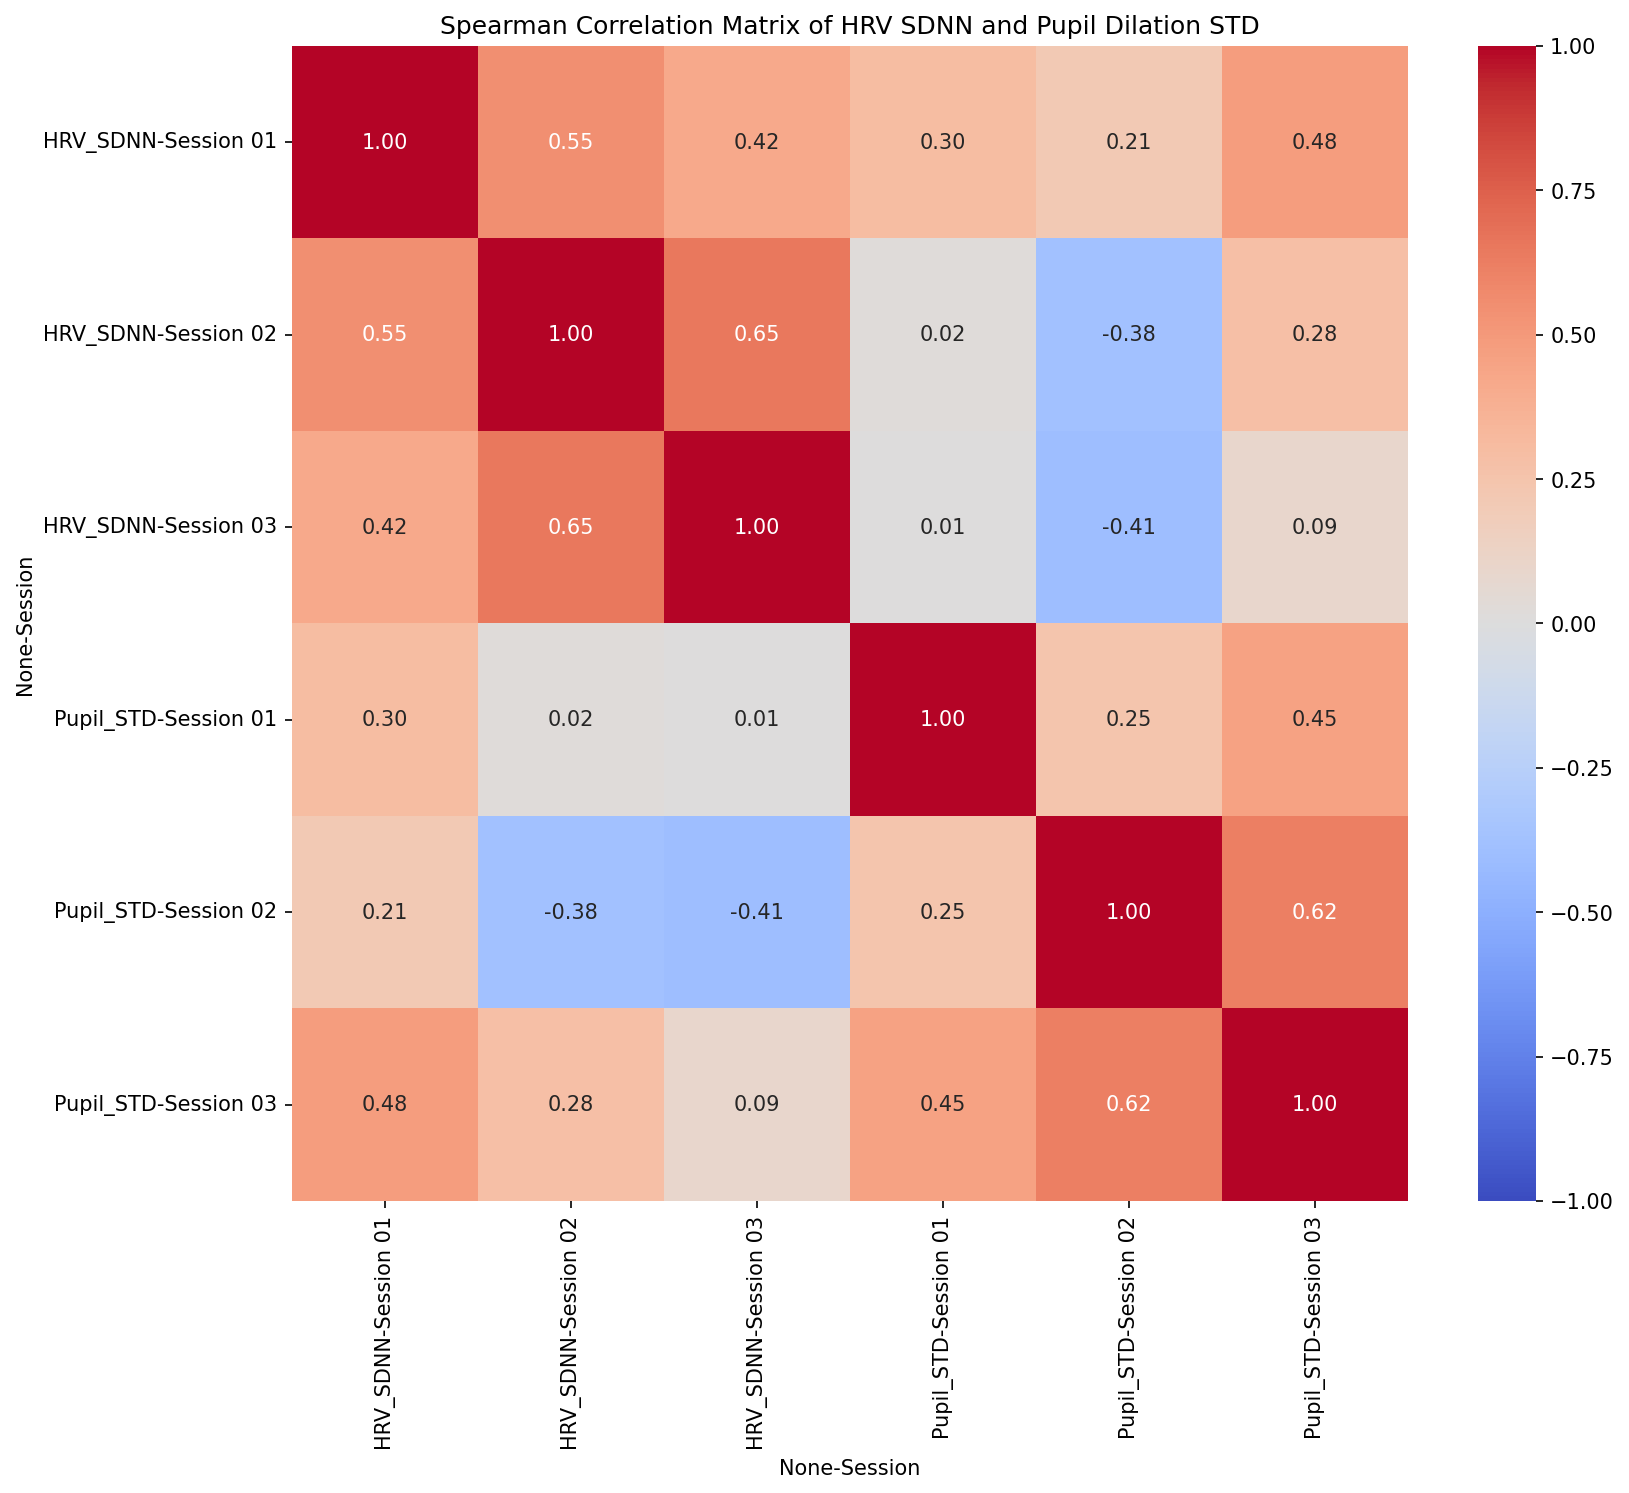
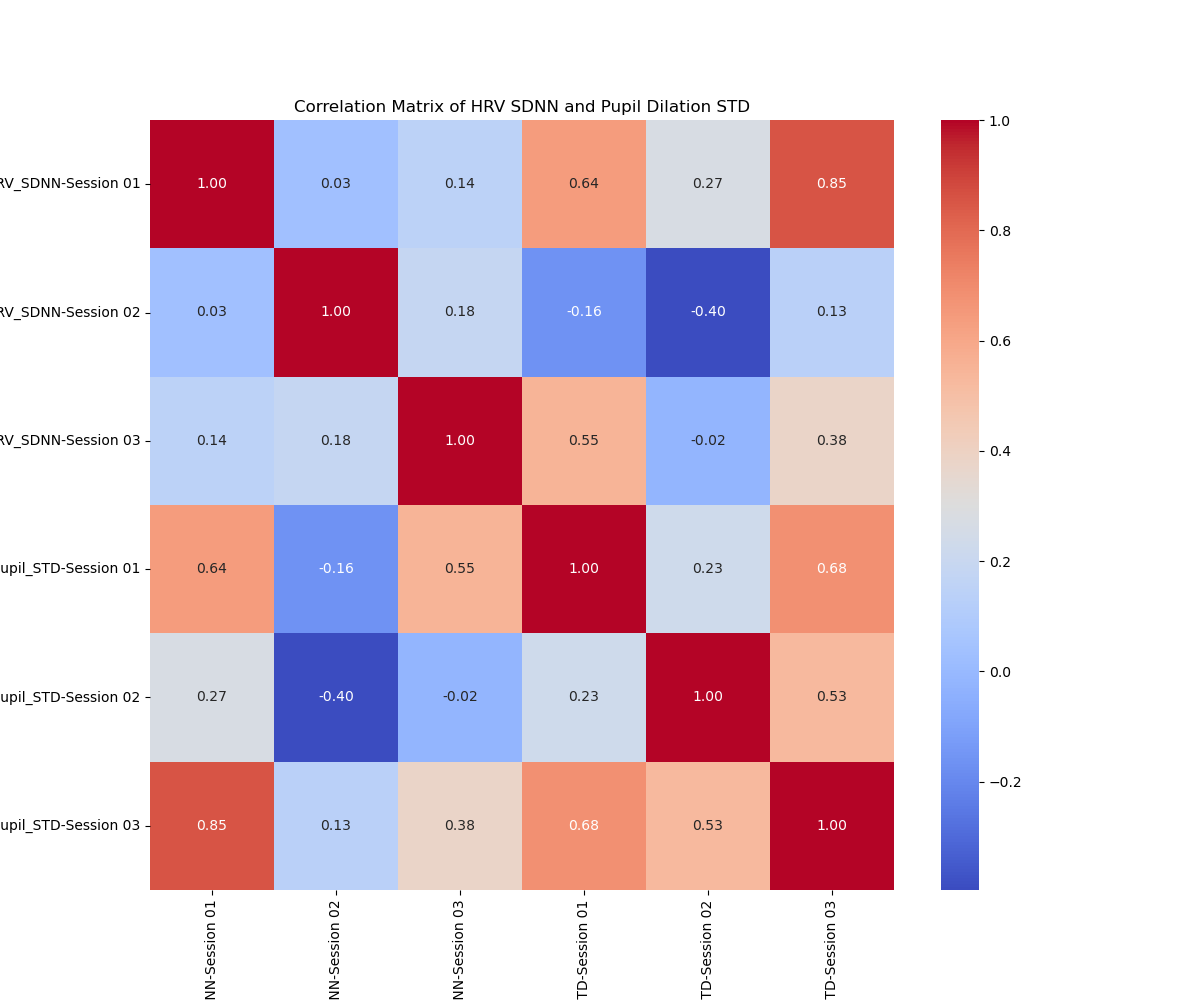
The README's reliability plot and the correlation plot use the three unchanged group tables. ICC(1,1) estimates have 95% confidence intervals calculated from the F distribution. Spearman correlations use ten participant rows and show no significance stars.
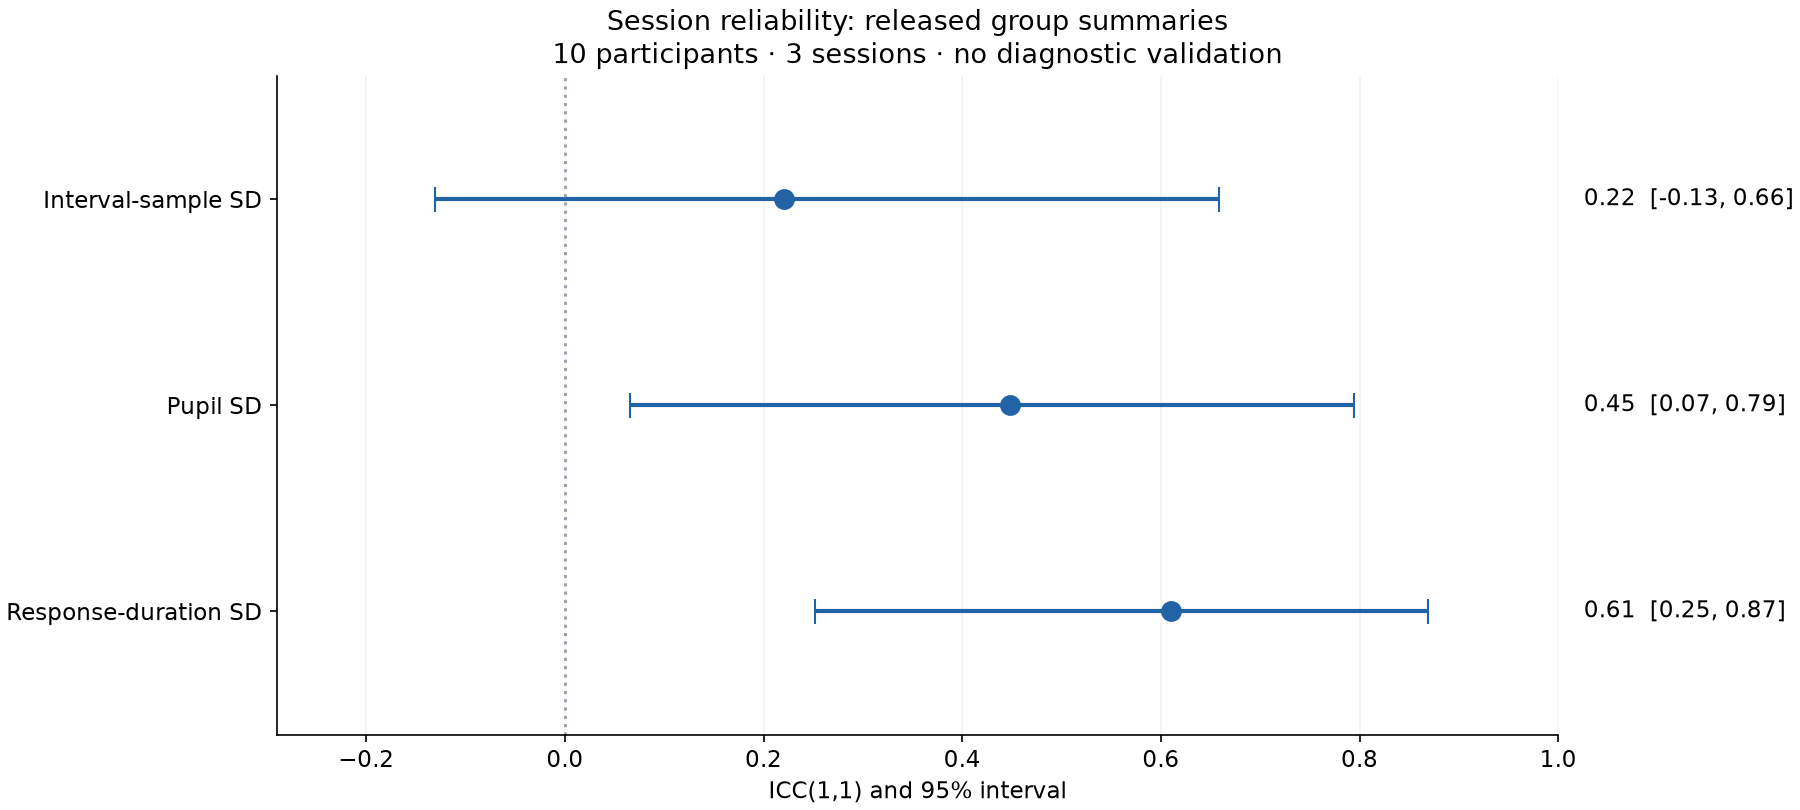
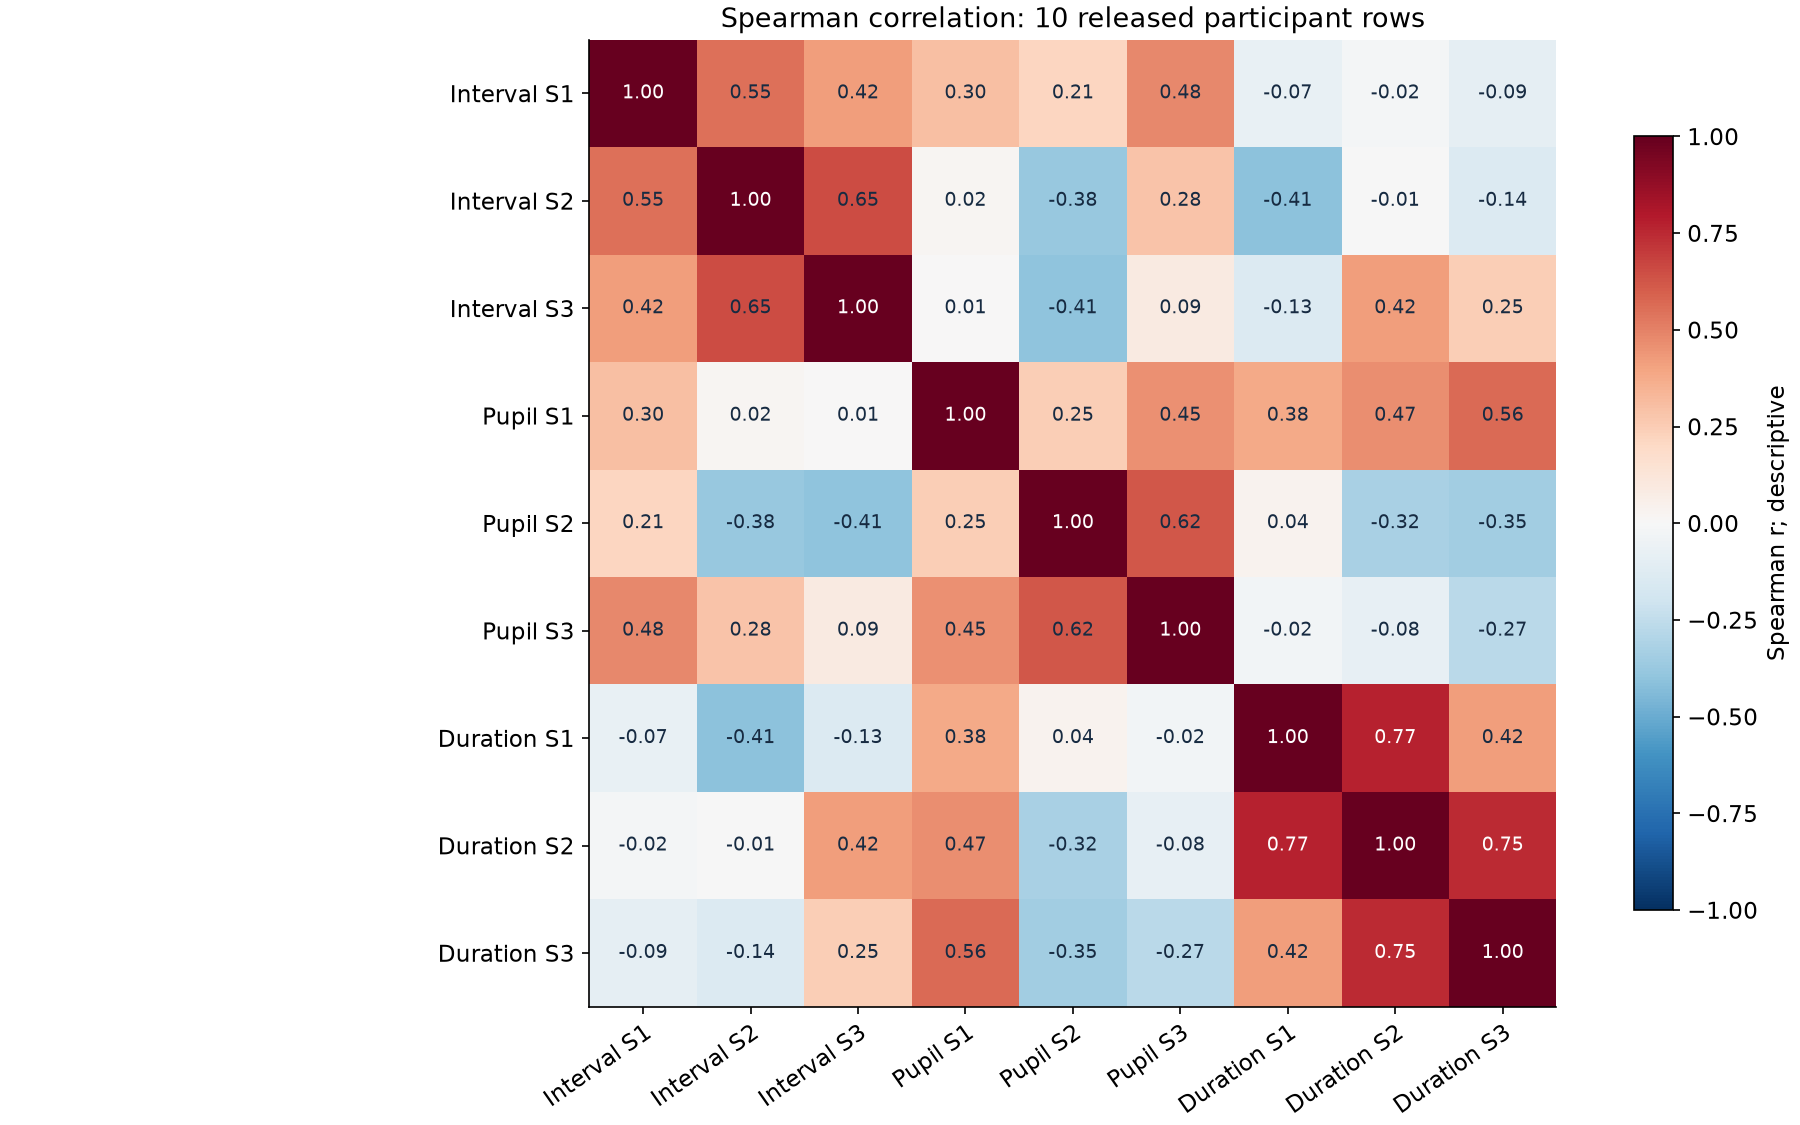
Most group rows cannot be traced to the available raw recordings. The calculations reproduce the released tables; they do not independently verify the cohort measurements.
outputs/figures.csv records calculated values. outputs/figures.toml records source hashes, methods and figure hashes. Run these commands from the repository root:
python -m scripts.build_figures --check
python -m scripts.build_figures --output-root outputs
Historical snapshots
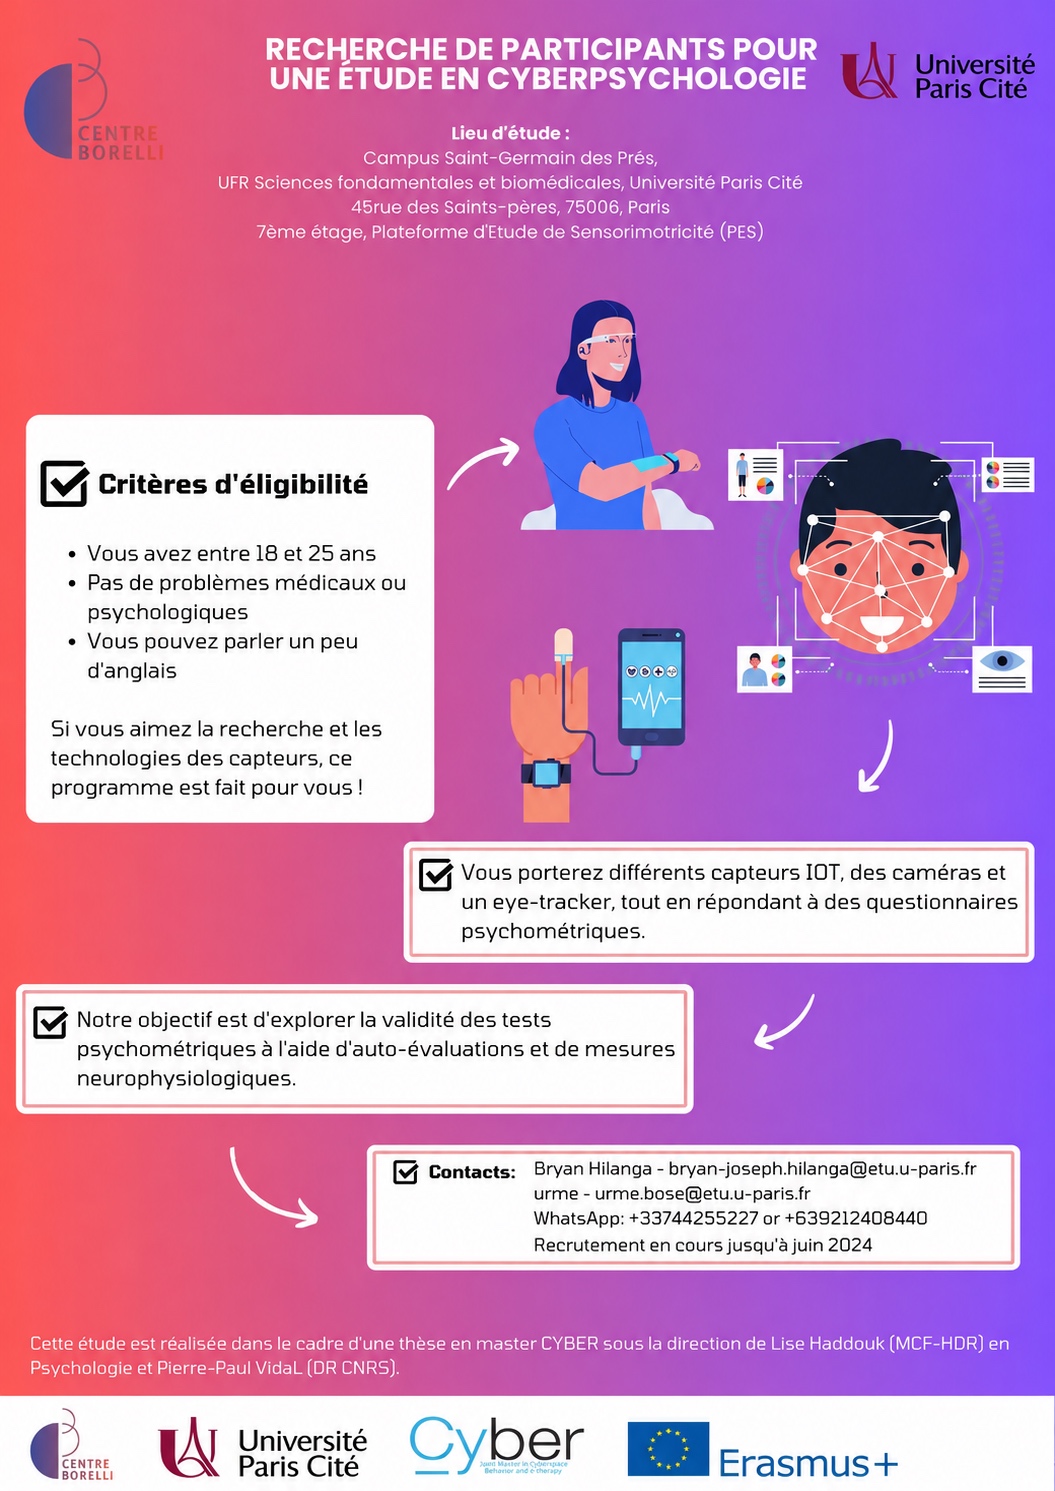
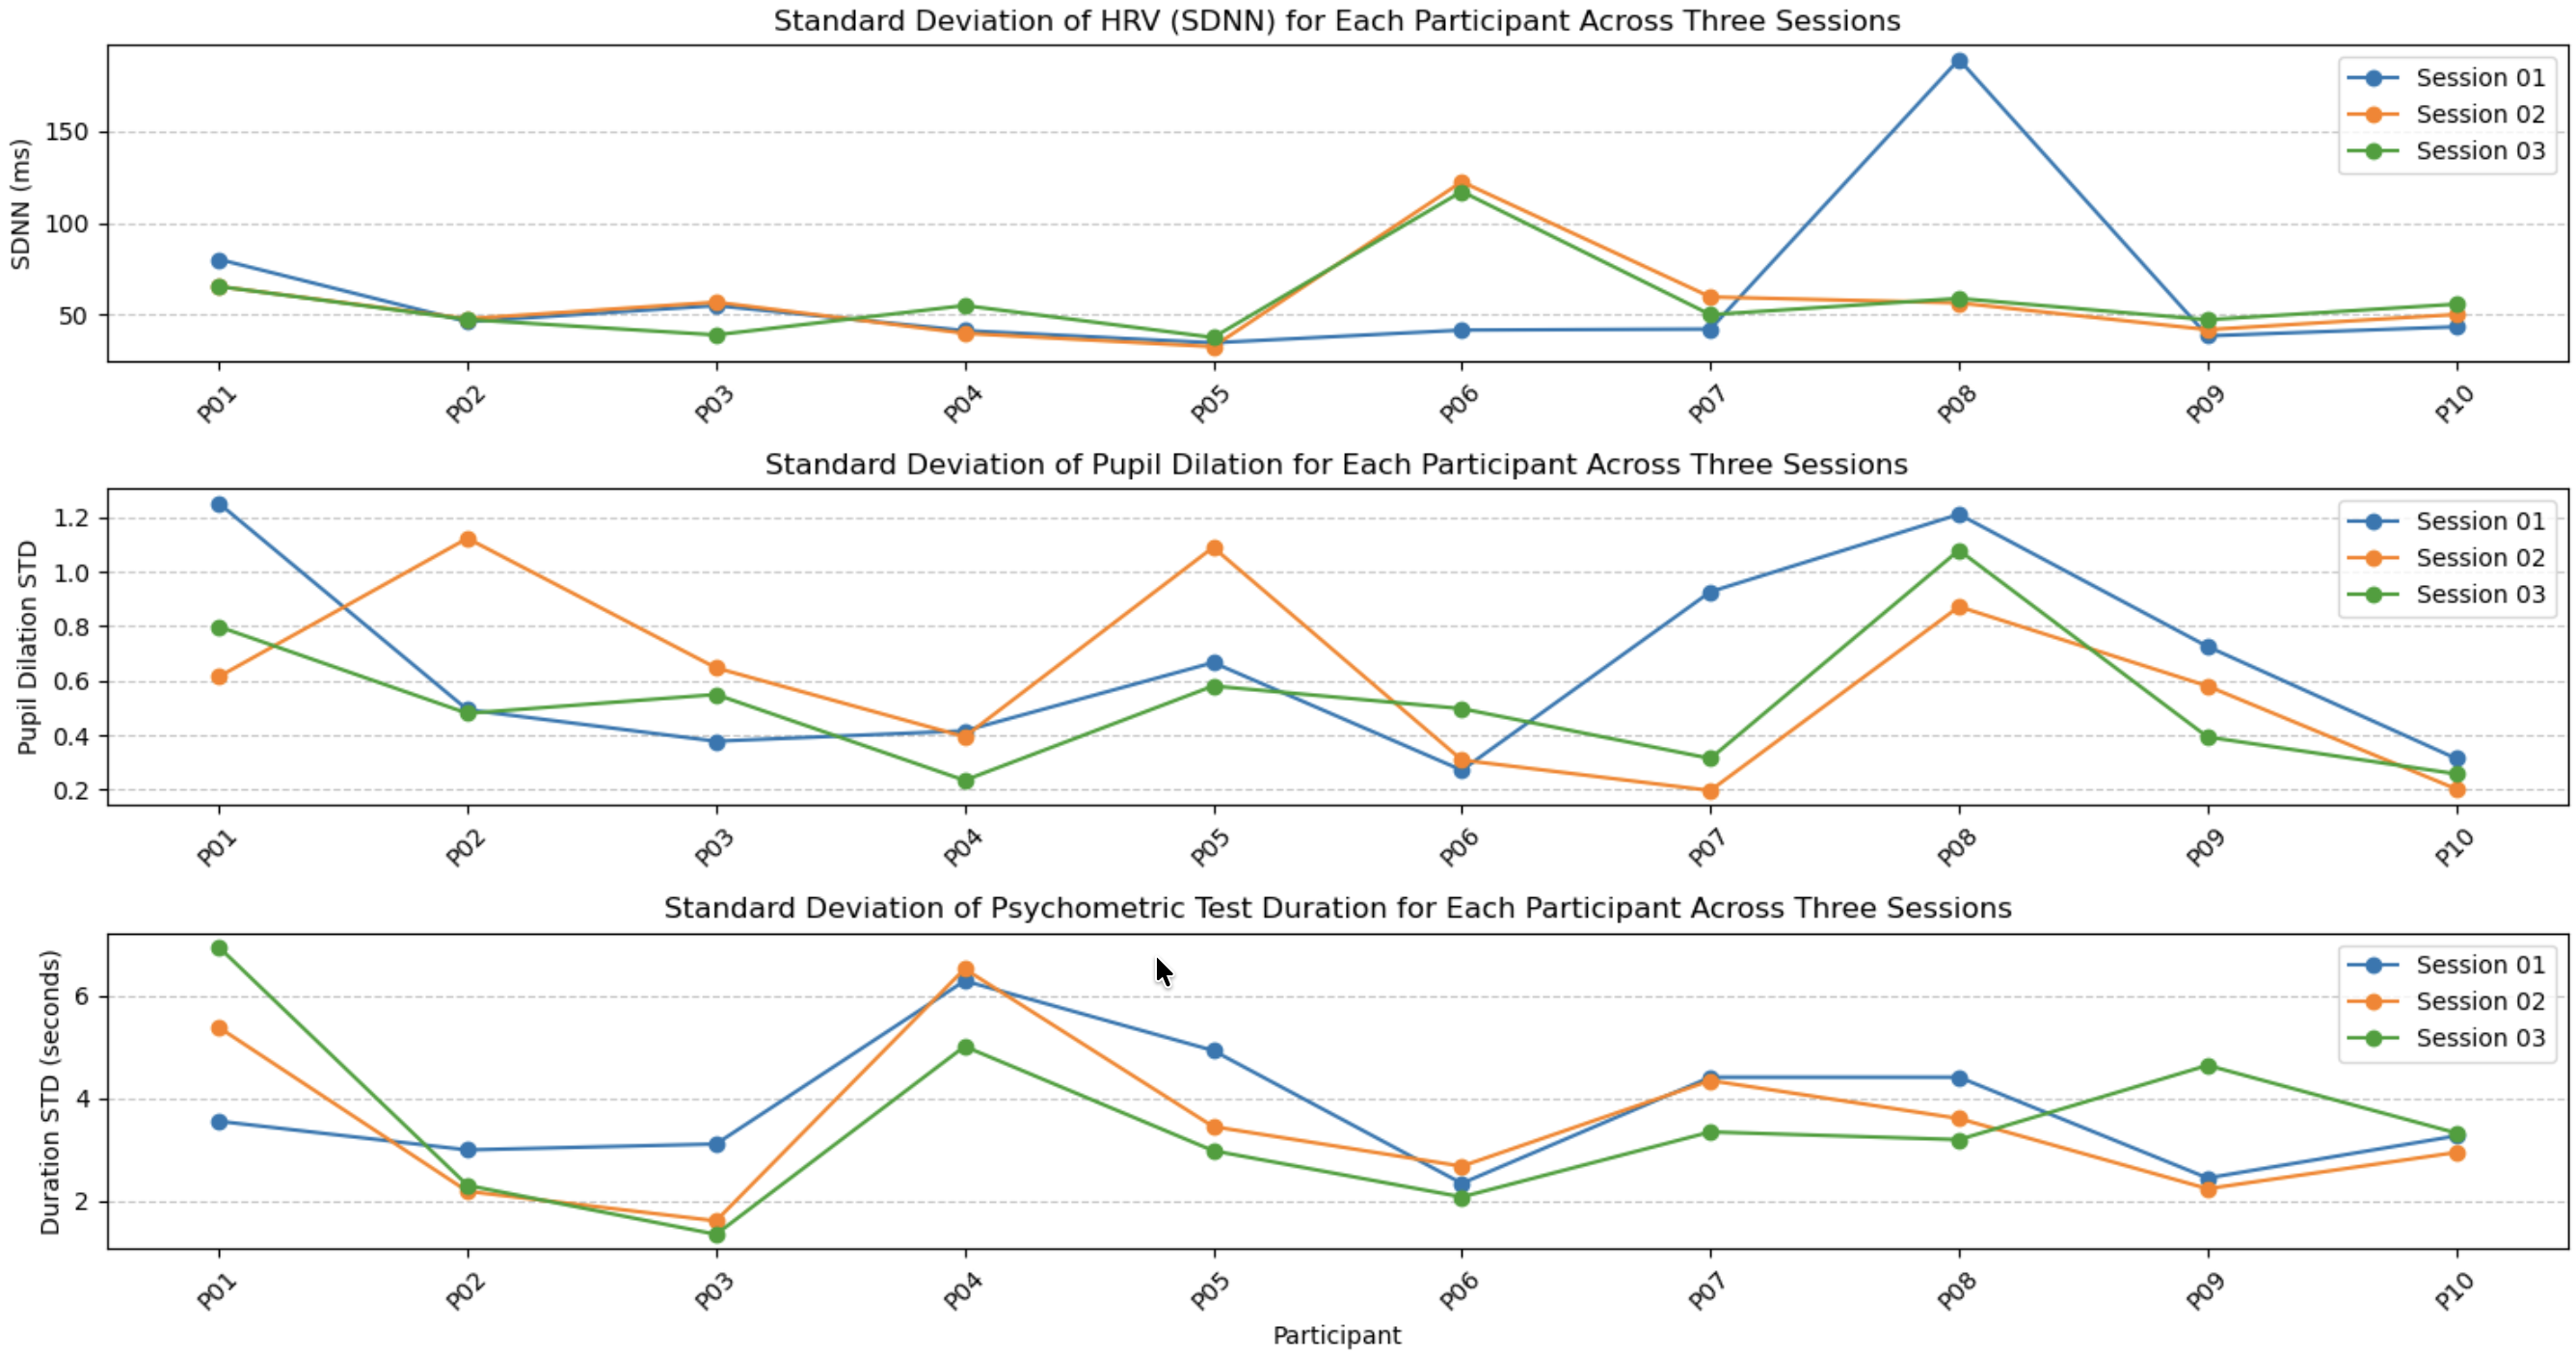
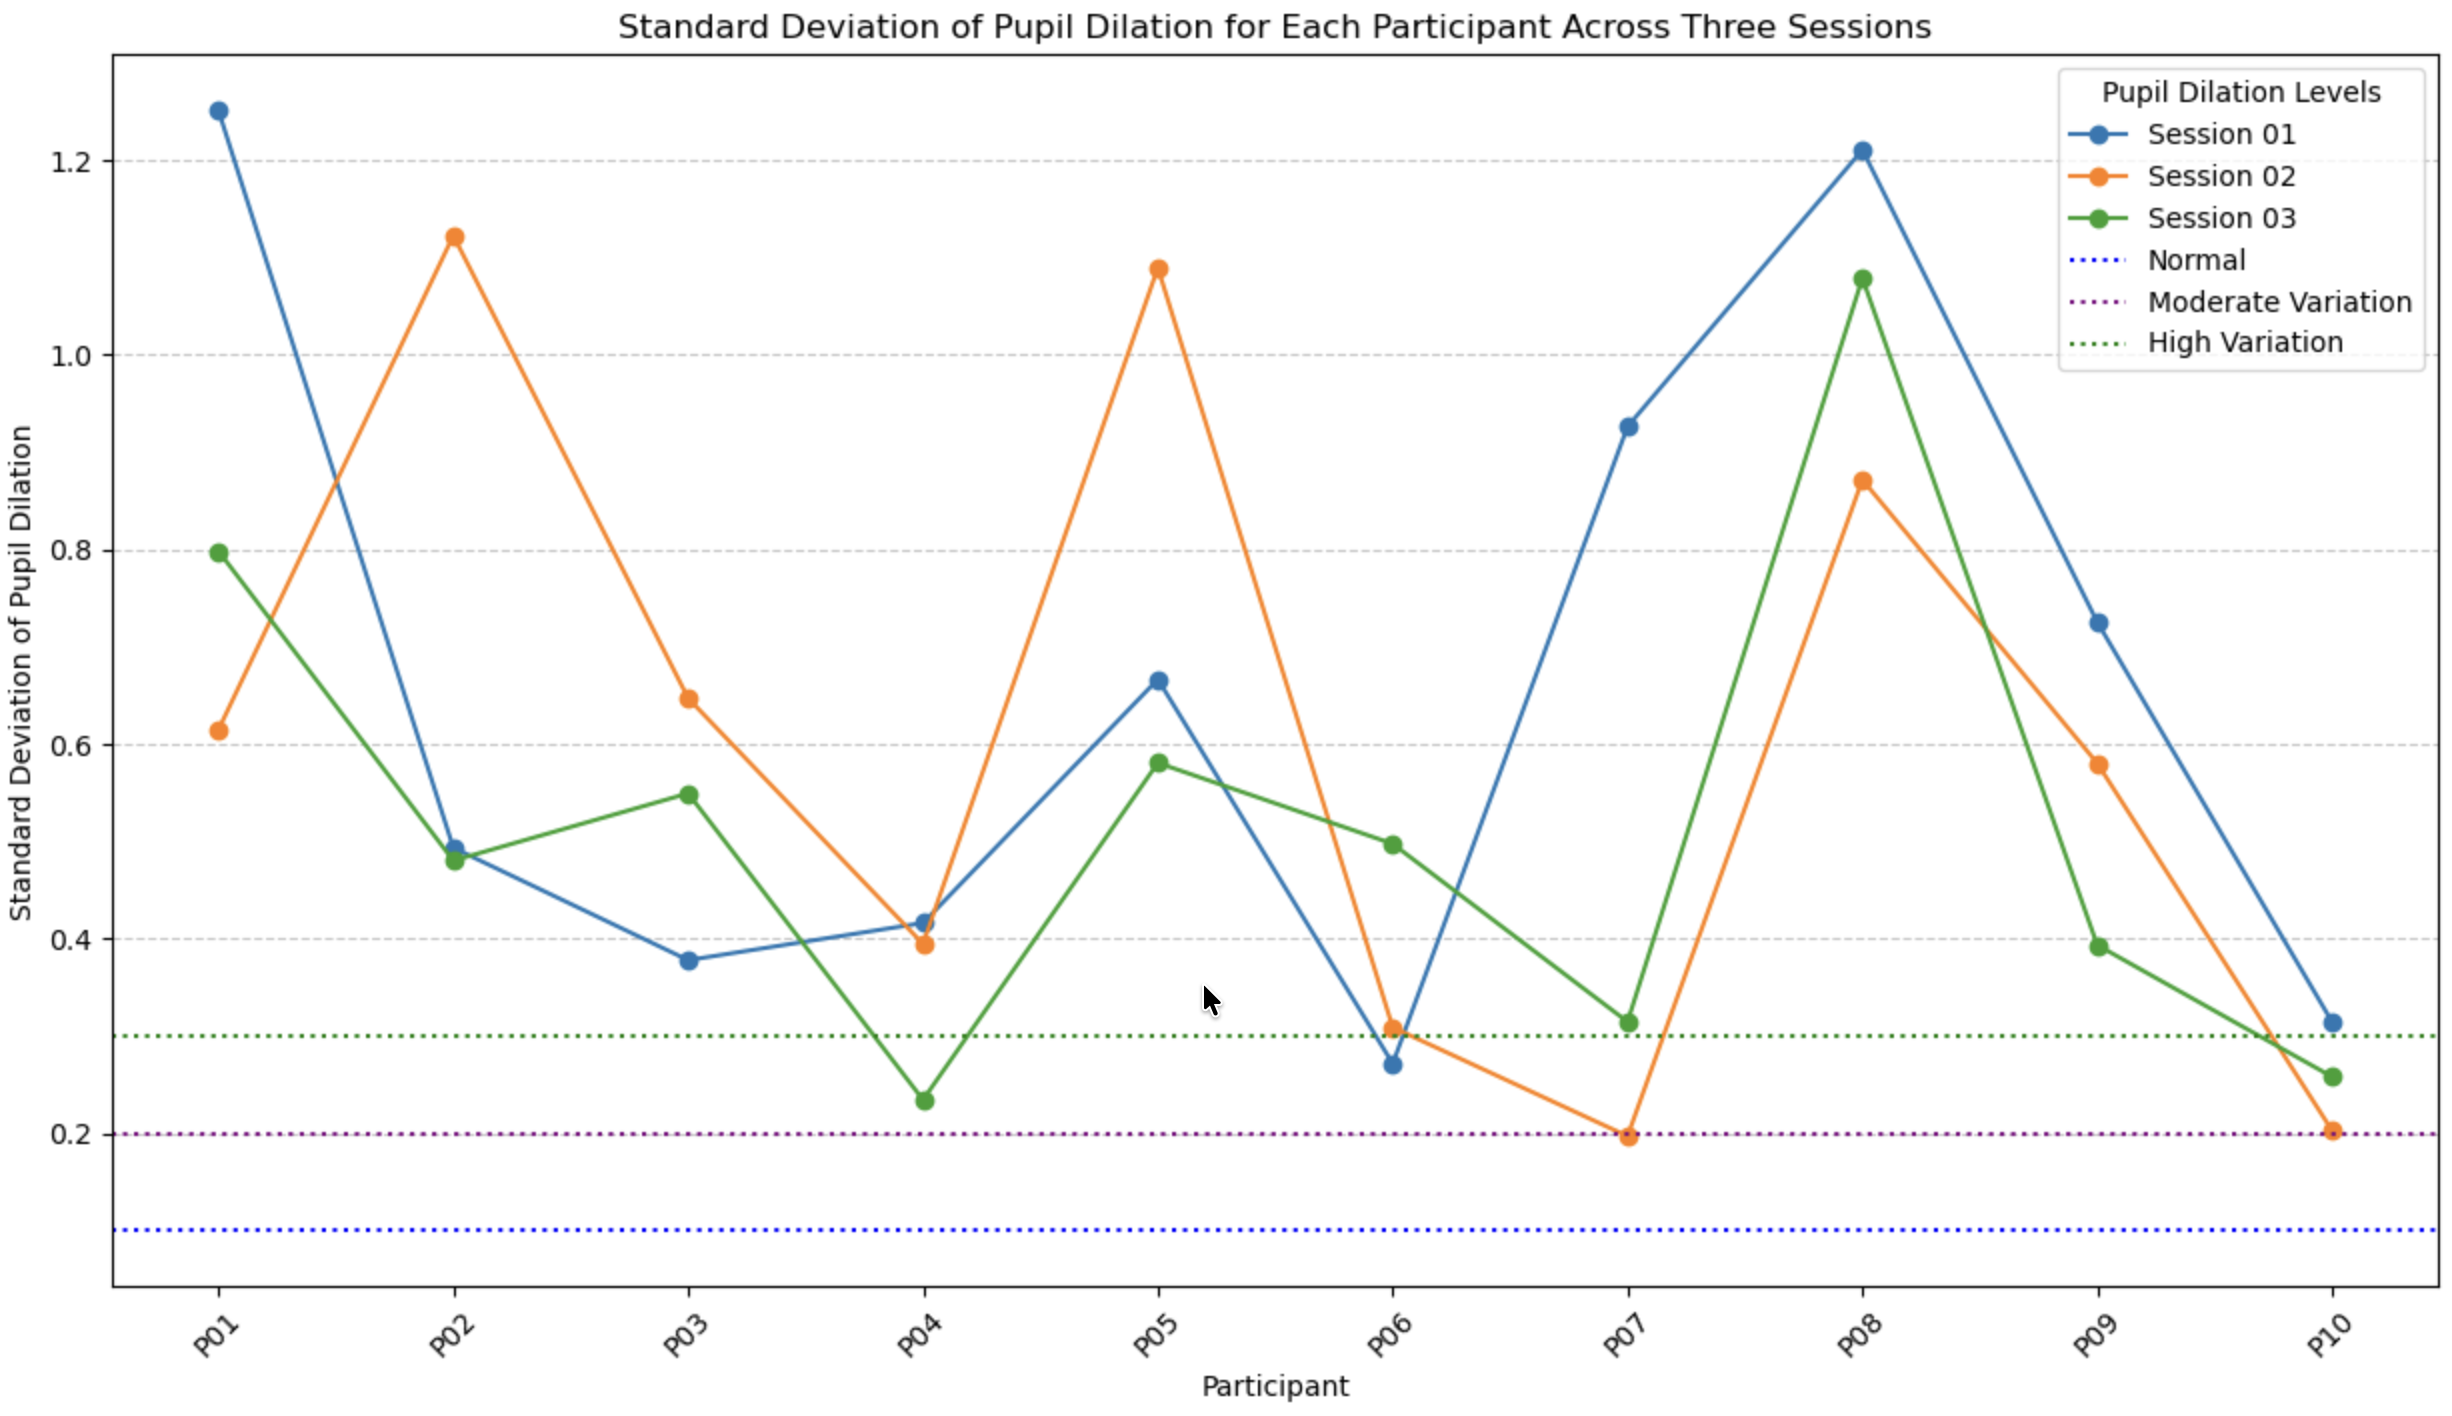
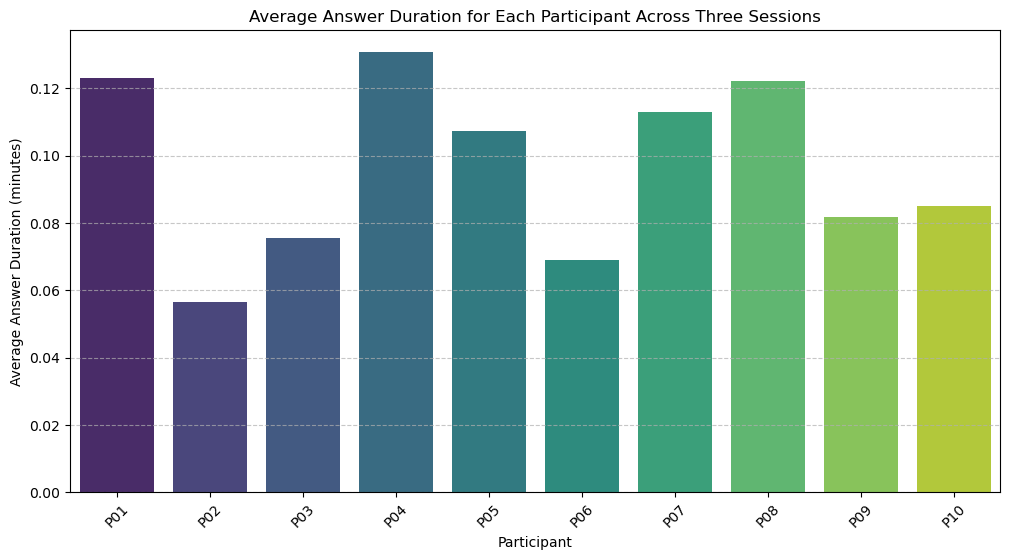
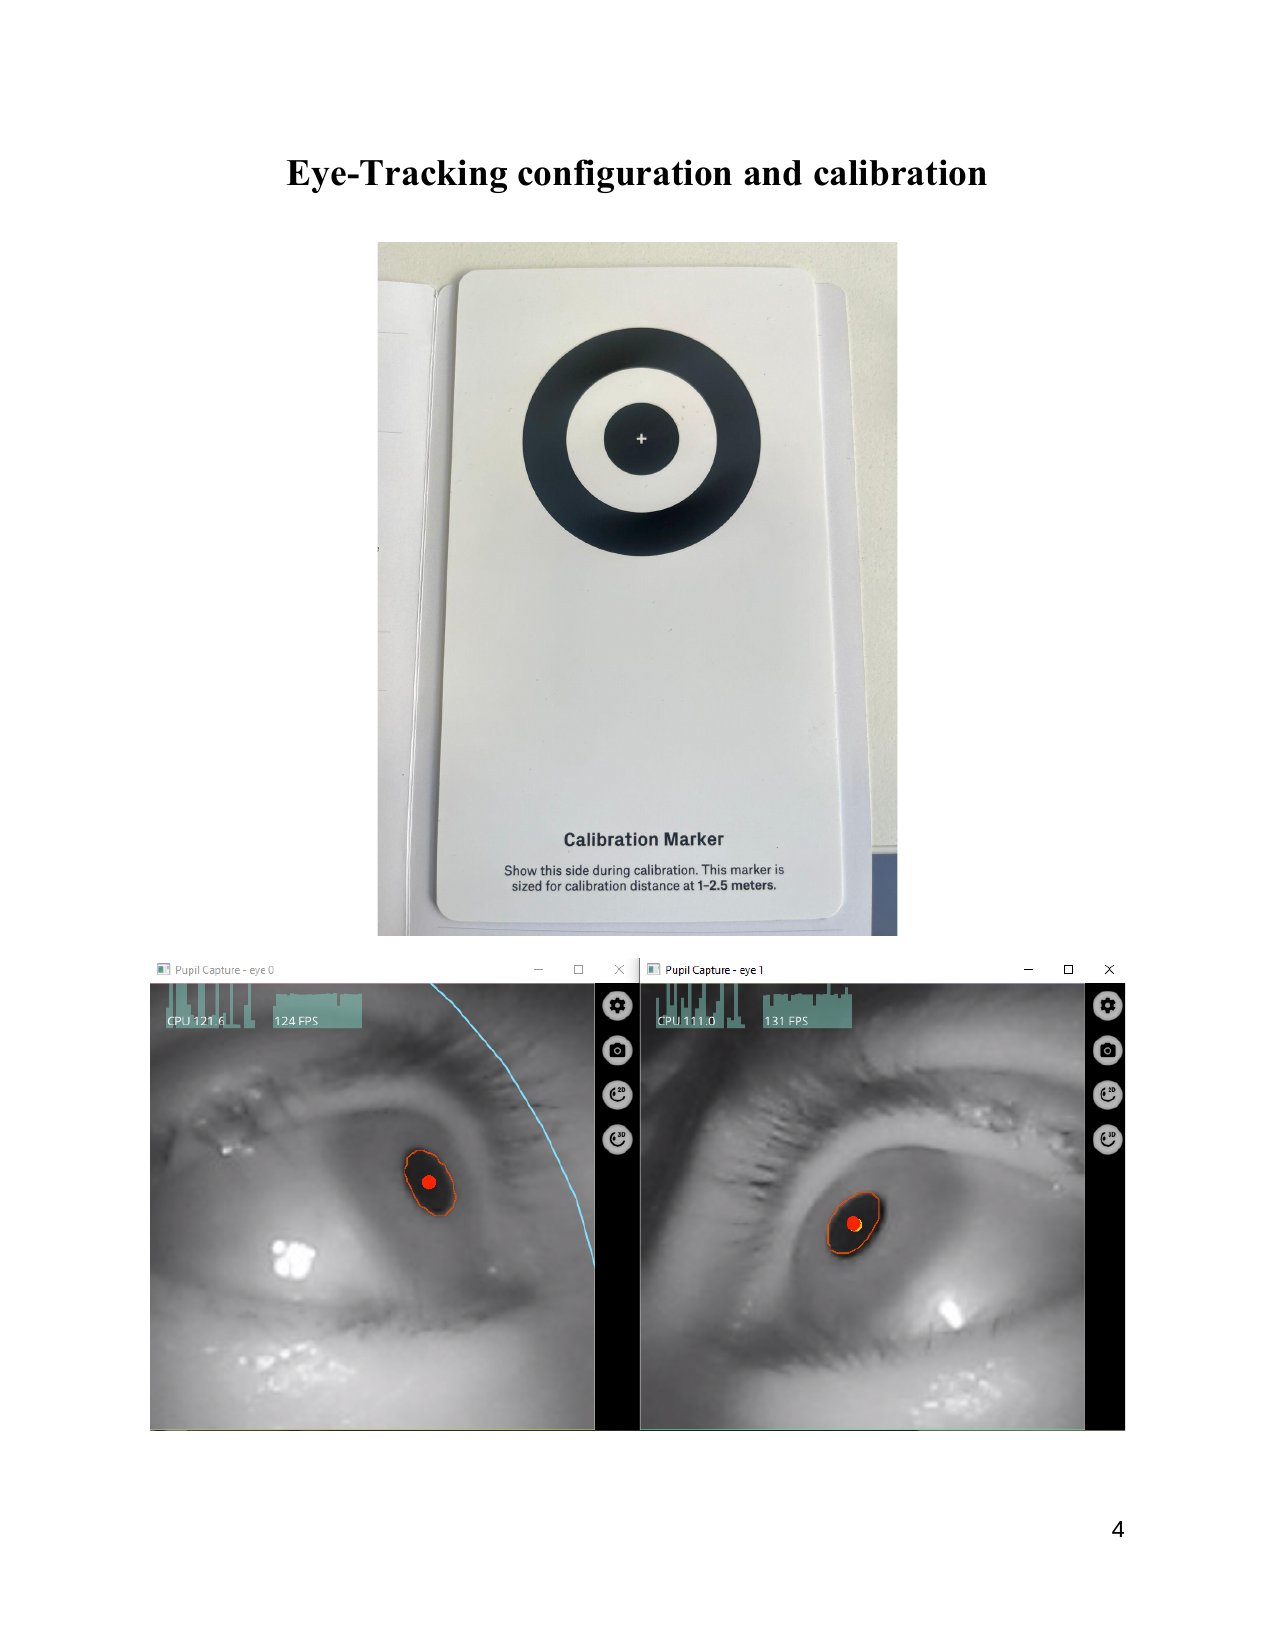
Historical images retain their bytes from release baseline a369ee0dc2dcac24feaa9e2e1faf160c39d5a3de. Plots are in outputs/; photographs and screenshots are in images/. The baseline revised the recruitment image; its hash below identifies that file. Acquisition and settings hashes are unavailable for these images.
- The former README heatmap shows interval S1/S2 = 0.03 and interval S1/pupil S3 = 0.85. The separately released Spearman image shows 0.55 and 0.48. Differences in methods or source snapshots prevent treating the images as interchangeable.
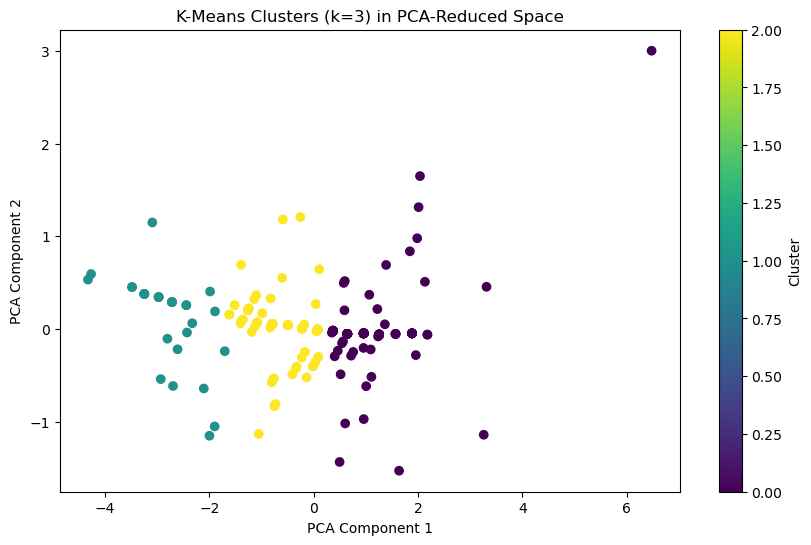
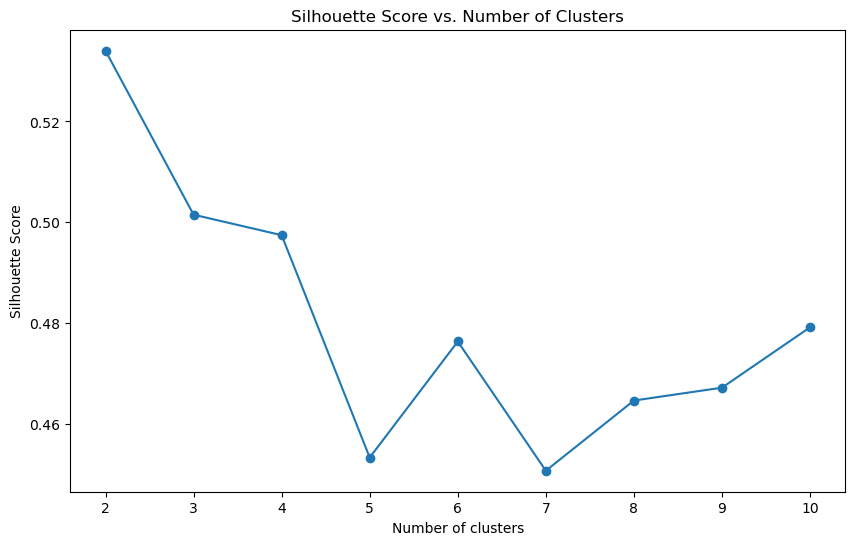
- The silhouette figure peaks at k = 2, while the cluster display uses k = 3. These historical images do not establish anxiety categories or validated participant clusters. They also do not establish that PCA preceded clustering.
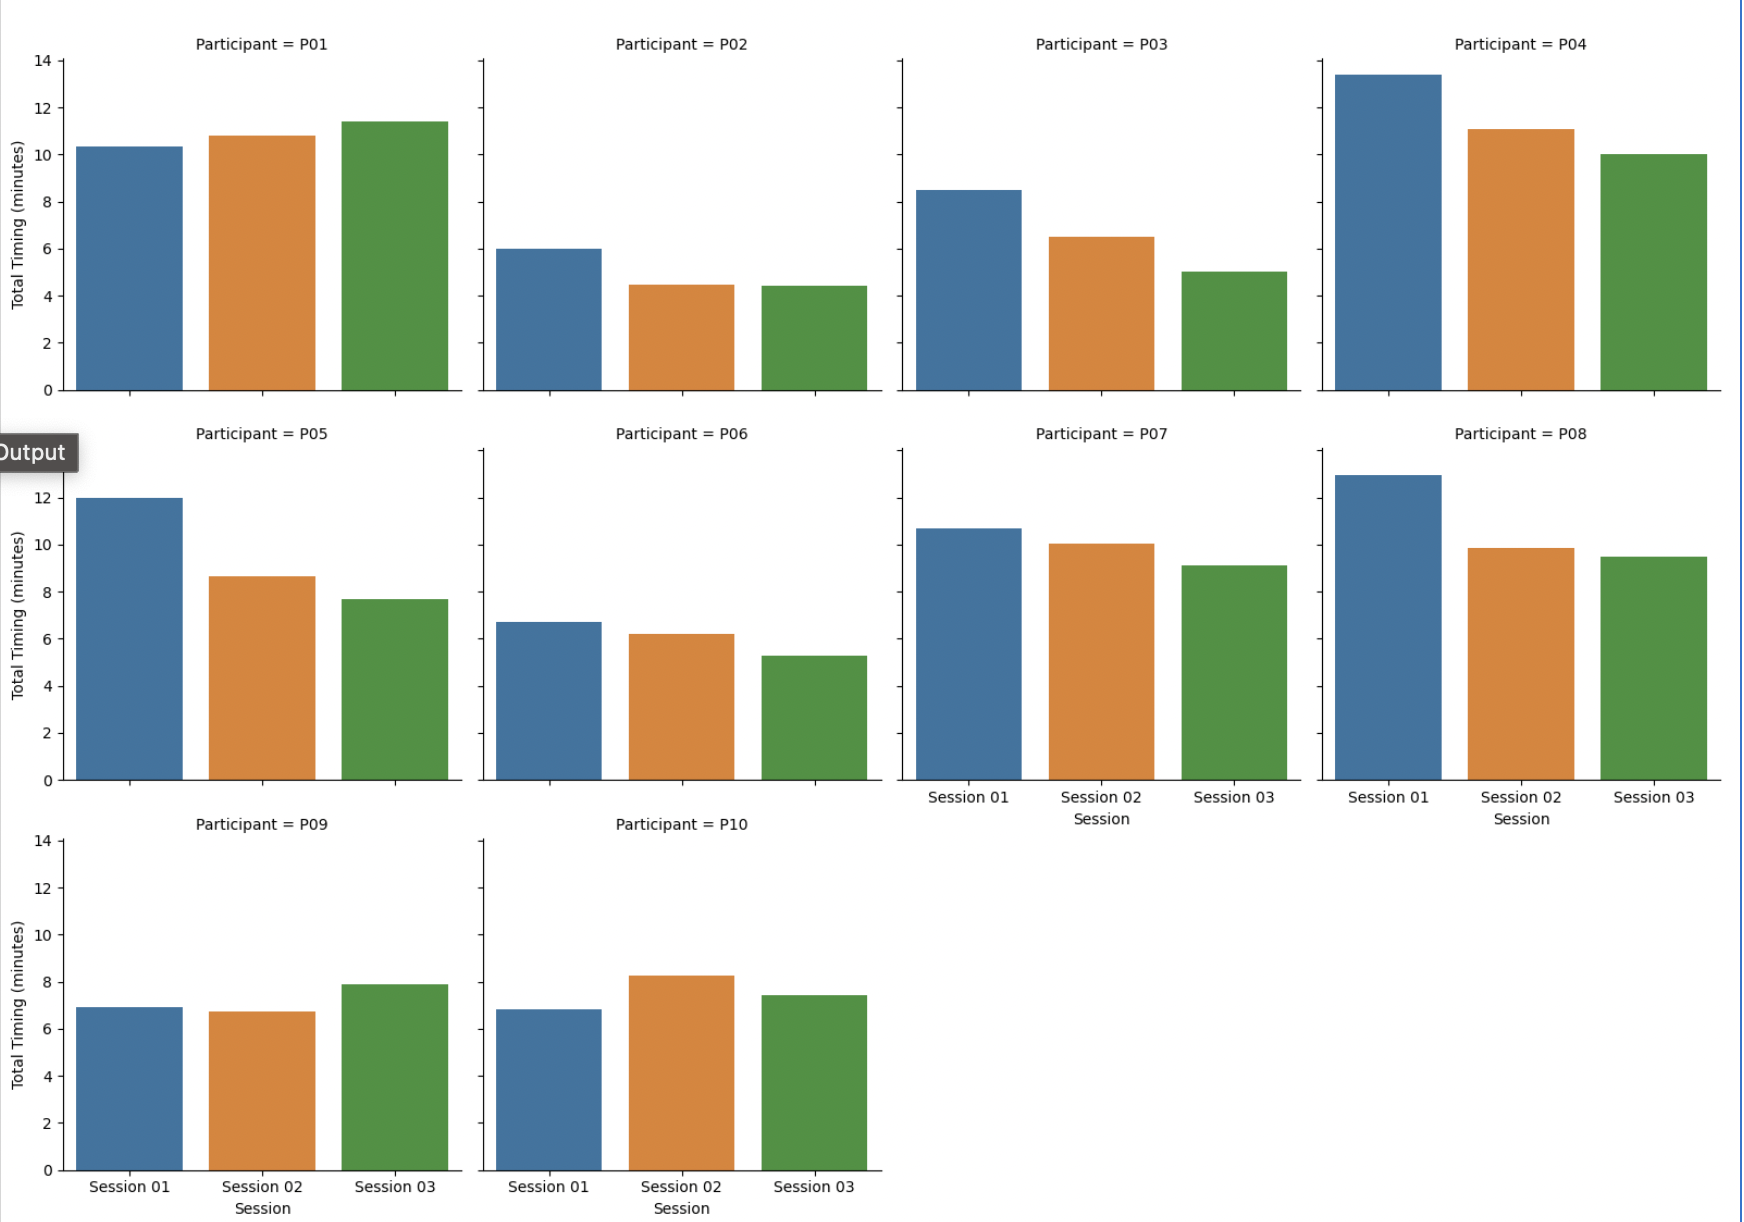
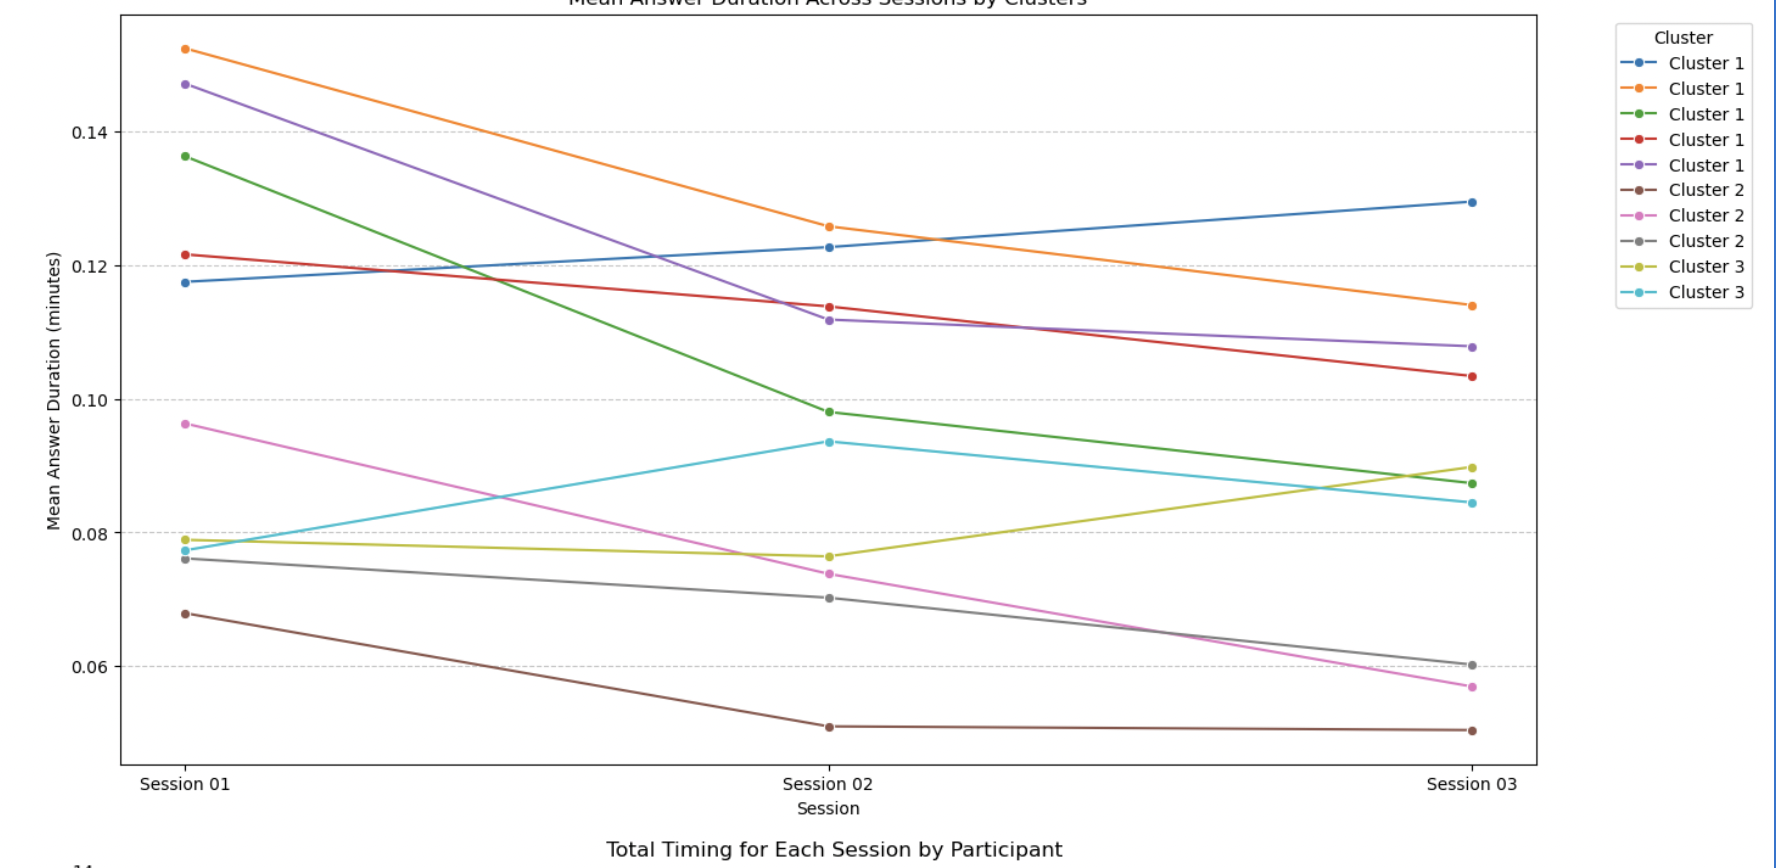
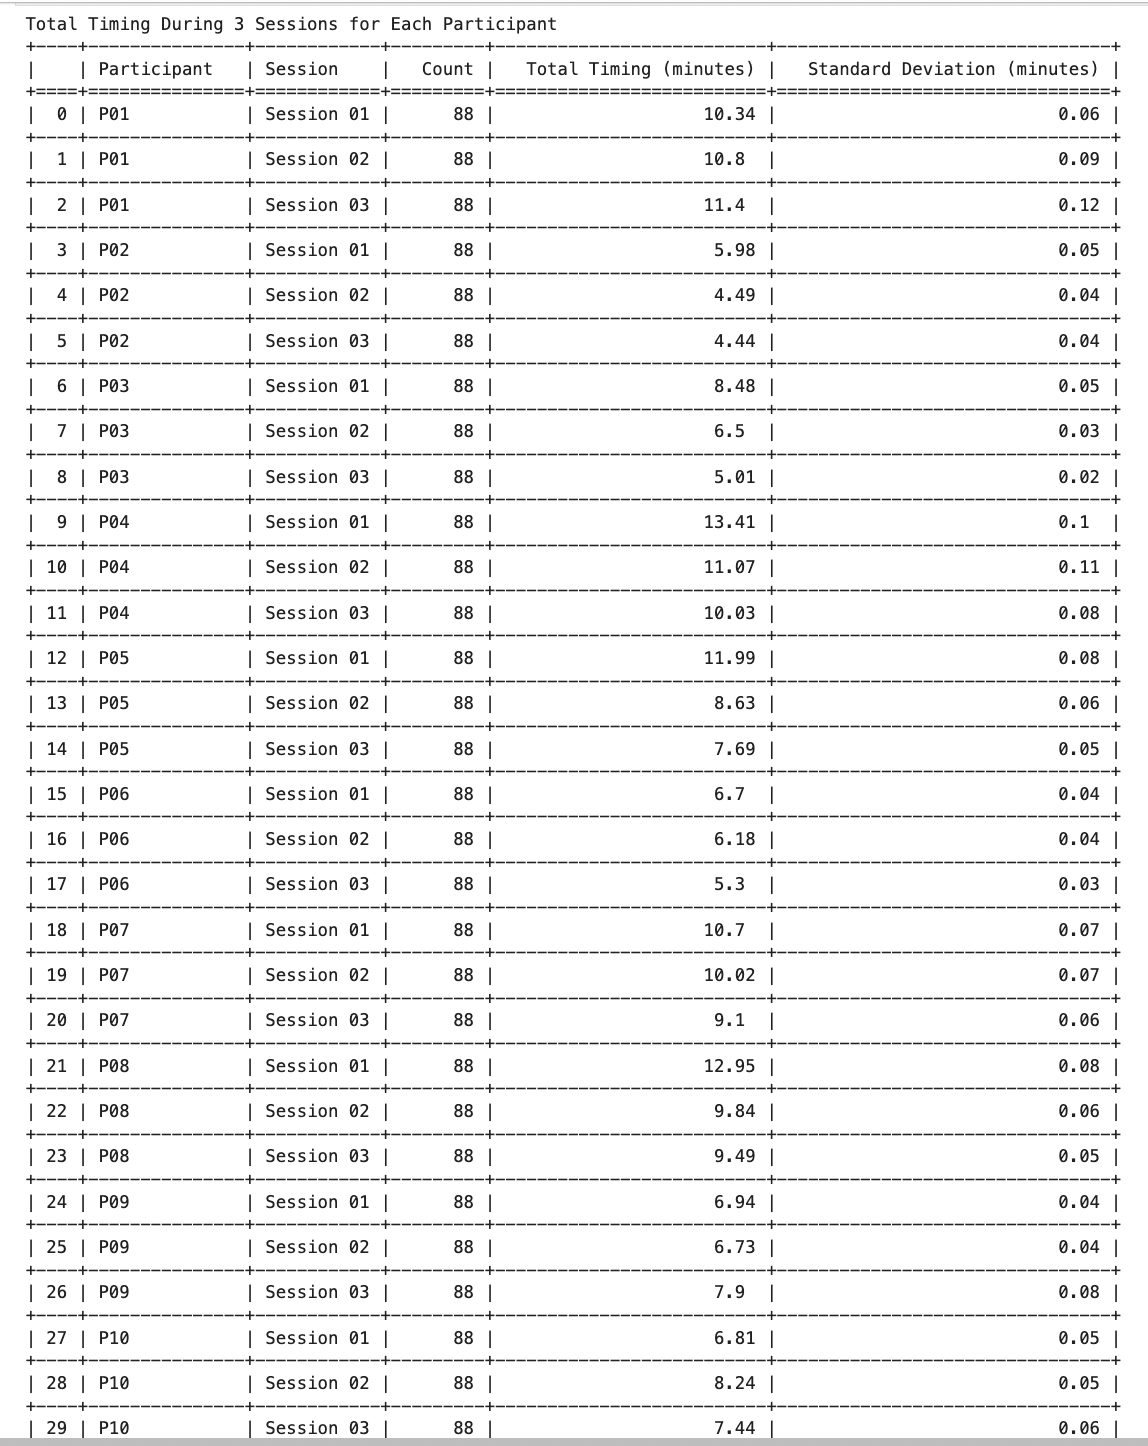
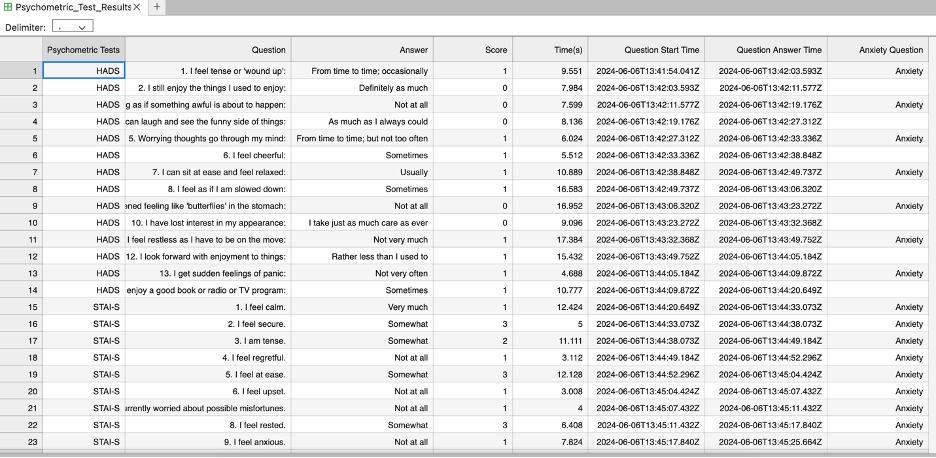
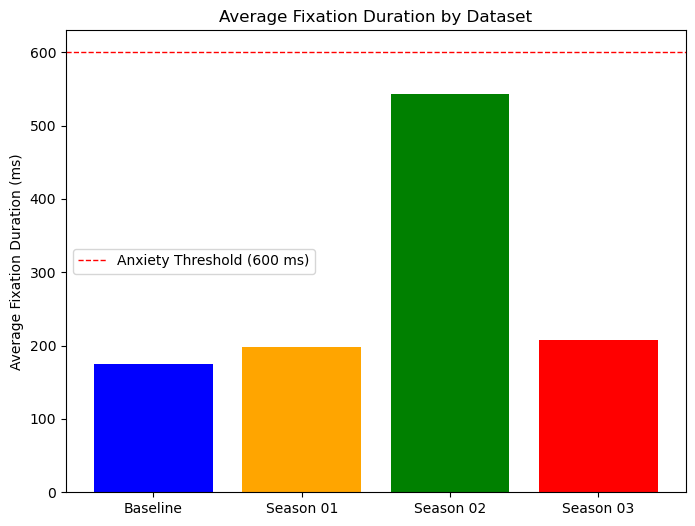
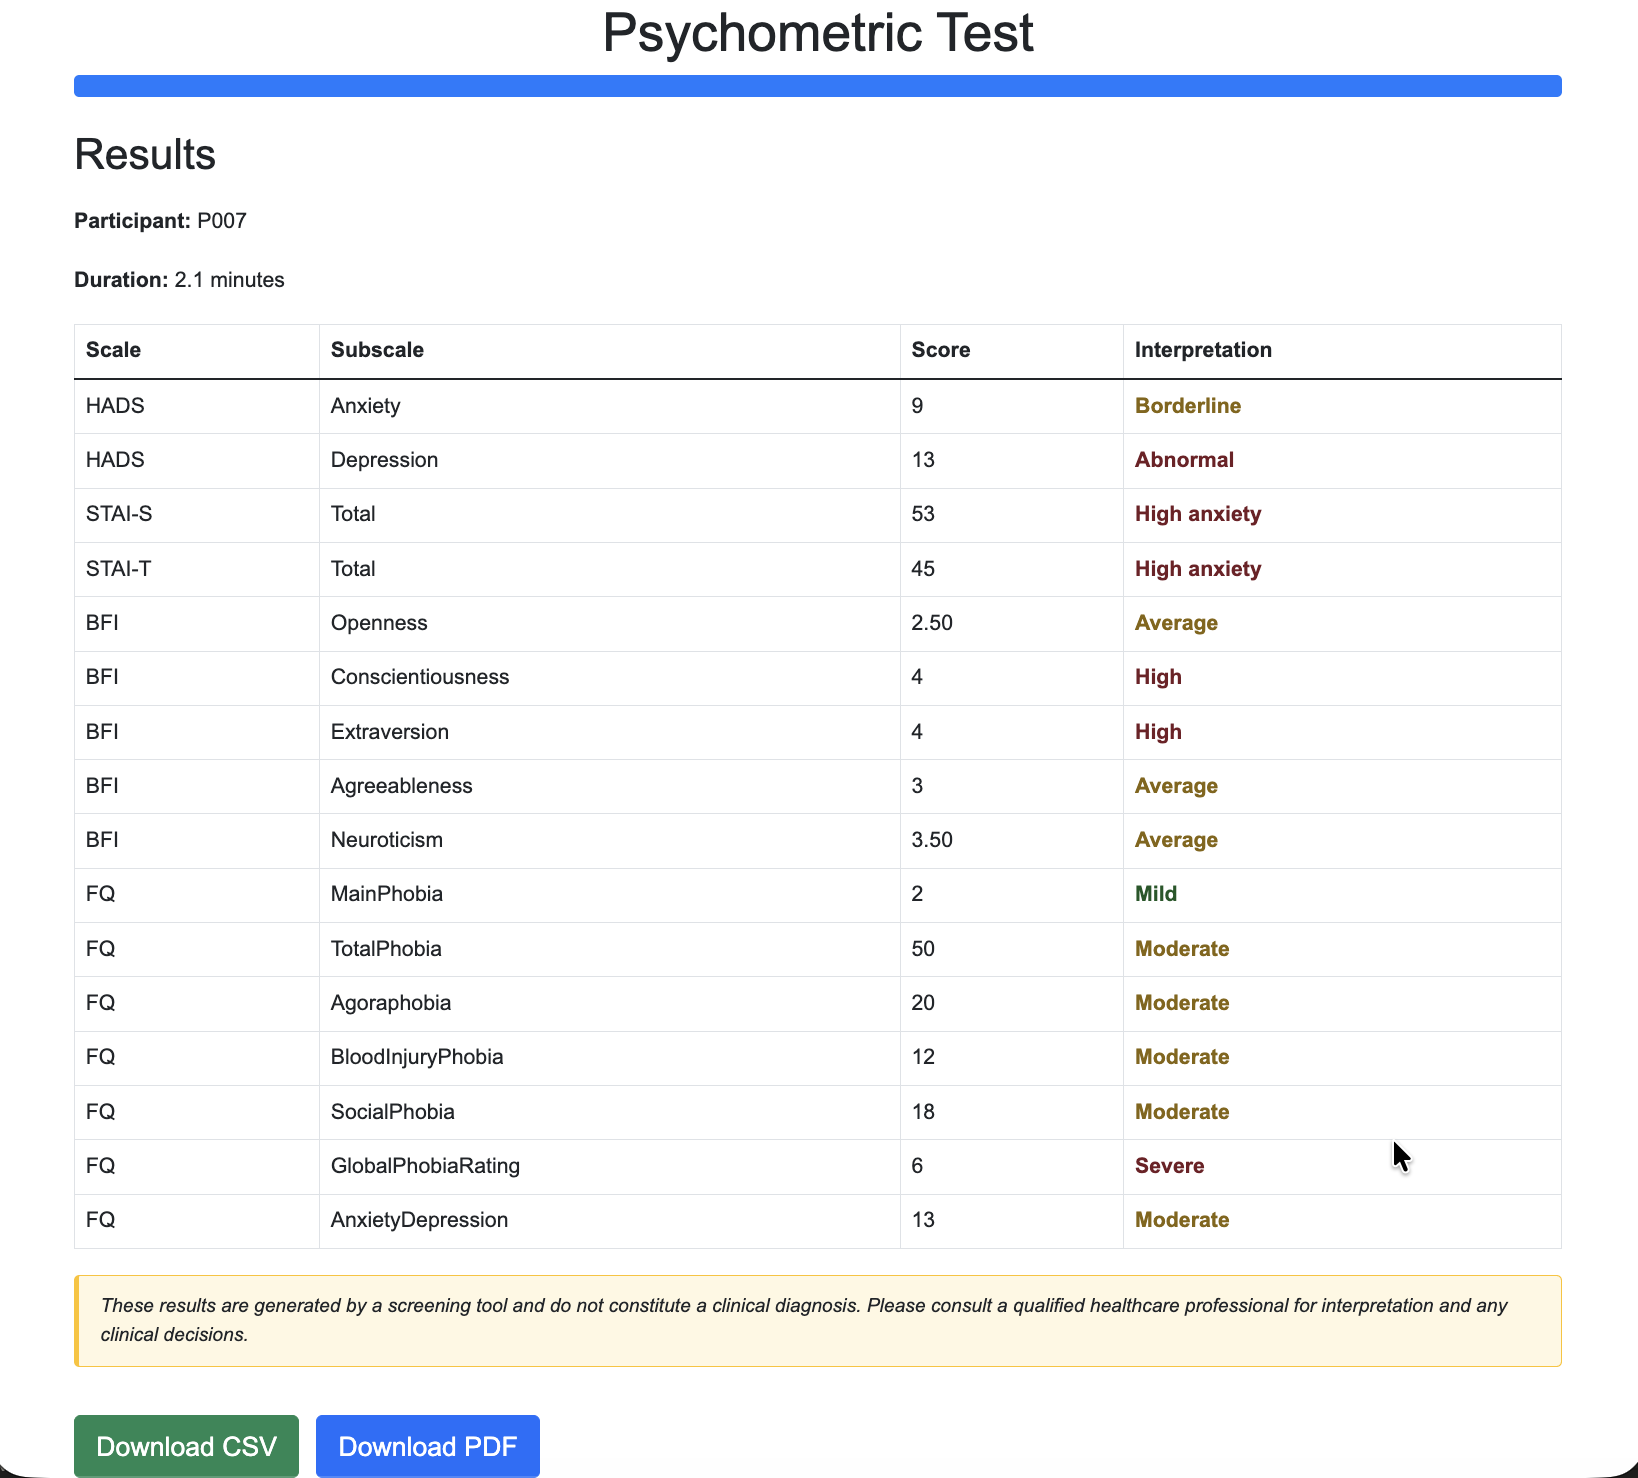
- Timing, pupil, fixation and scoring screenshots retain their historical labels and source values. Current results exclude unsupported clinical cutoffs and mixed units.
| Original path | Preserved file | SHA256 |
|---|---|---|
data/group_results/correlation_heatmap_with_values_final.png |
legacy-spearman-heatmap.png | 3dd6620466f3789fa4e838d320131e085bbfb3156878b0184ce912eaf00f5230 |
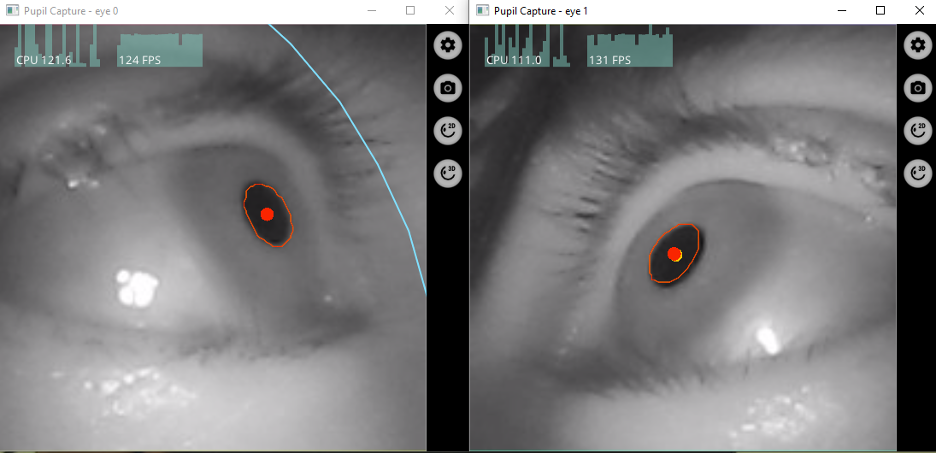
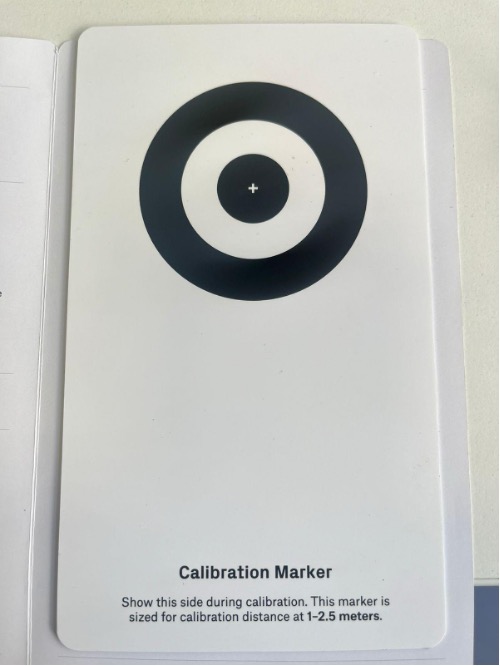
images/Eye-Tracking calibration.png |
Eye-Tracking calibration.png | 175110cc7f0b3fefac96c452d1143cb24f18e59a4247242741946e287518a124 |
images/Eye-Tracking configuration_01.jpg |
Eye-Tracking configuration_01.jpg | 3f8c3cfe20165e4da7cb5586a0ff4818c9be69d56c4a372898b3fccb561b0731 |
images/Group Duration.png |
Group Duration.png | b31e6266768fe6539eb793e6845a00ba8459cc6ce8b9fb9256f33892c3734edd |
images/Group Eye.png |
Group Eye.png | ebc749f826e8c7ac18c5ad4bc4c539cae5dd2382936dd7e13f66a1f0732ab1a9 |
images/Group SD.png |
Group SD.png | ab1e51352ec1776eeaa7e781114044b38b00bd1285a6a5f970298628bdfb4d8f |
images/Psychometric Test dataset.png |
Psychometric Test dataset.png | ed404ec4253e4b3606bd54548ee2cc5b23c2d9faaf2a23ede7f148e9005d032c |
images/Recruitment ads.jpg |
Recruitment ads.jpg | 70d49eaaa3fa4859224a453be9dc008ba036f0df737864a362e8b9276855b839 |
images/Standard Deviation of HRV (SDNN).png |
Standard Deviation of HRV (SDNN).png | 2ab6d8445a4a965b426450f78d7bc9e342ffdceec05ff6b010317b830f284f01 |
images/Standard Deviation of Pupil Dilation.png |
Standard Deviation of Pupil Dilation.png | 3549bc8c2eb315ce32d276166273b7c8ea3450c79e95e2d908a7f837f502d65d |
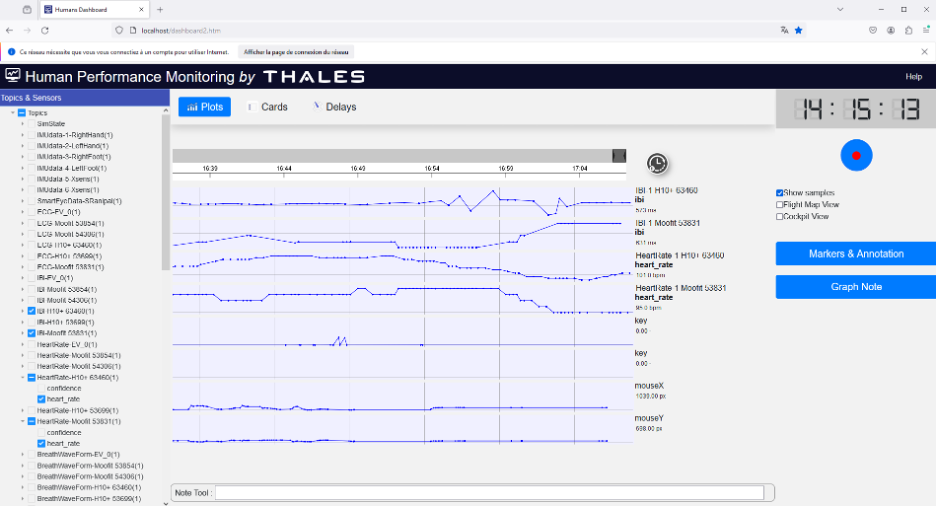
images/Thales Human Performance Monitoring for Data Collection.png |
Thales Human Performance Monitoring for Data Collection.png | 8a843ac588877aab005f5b4de6e44e1b536e572ffd53c5670c50eaf62b4f5583 |
images/avg_answer_duration.png |
avg_answer_duration.png | ac8d8da4ed24244cb84f3b99a1fa69a472f6b1d67fcd6b126e5858c209b7fc76 |
images/correlation_heatmap_with_values_final.png |
correlation_heatmap_with_values_final.png | 6f155699383a671c9dc0bb1a1d6f0d146bb126a101566344666a23cf5abddc5b |
images/data_collection_session.jpg |
data_collection_session.jpg | dfde565f00fce8c470387dee05a3524e721fd99f25f7c2baf28a51269bb54400 |
images/experimental_setup.jpg |
experimental_setup.jpg | c22de2d13f22875fc78a06ba67cbd0011f150649e5a87083a0f538c139ef7a5e |
images/fixation_duration_by_session.png |
fixation_duration_by_session.png | 00299c97bde818a7dbd64e4cacecb77ab2da2470e2a6c8fa64e9540d016a3e88 |
images/participant_testing.jpg |
participant_testing.jpg | 5ce9985b4b612dabc1343d95cf3e646e47b19e23780b22c1d961cabb52d9b210 |
images/pca_kmeans_clusters.png |
pca_kmeans_clusters.png | 3bbae16eac9b450b4525604717b4d925d5a000a7ae8924a306b5e72555510d80 |
images/scoring-results.png |
scoring-results.png | 5b7ec9b7d05f57d86a1b9027e62aa706ac8aa66d8981705a024a76a29d44c40d |
images/setup_page_4.jpg |
setup_page_4.jpg | ded359afc1d271e285819453694b7a009d2a1f4834c038f14a1846f68898dfc4 |
images/silhouette_score.png |
silhouette_score.png | a6e2d6a0544ceb6a7fd55d439ea76c6516c4554035bdc38df14faac0397ede81 |